1. Introduction
DrawMode is a diagramming tool built on three convictions: it is AI-native, it is web-native, and it treats team collaboration as the normal way of working rather than an add-on. Diagrams live in shared projects; everyone with access sees the same canvas, edits land live for every participant, and the built-in assistant can read and write the same diagrams you do.
The guiding principle throughout is low friction. Modelling tools for software engineering used to demand great precision — every box placed, every property filled in, every line routed by hand — and that precision tax is why so many models were abandoned half-drawn. DrawMode deliberately lowers this friction and ceremony: gestures put the right shape under your cursor, layouts arrange themselves, and where meaning matters the AI can interpret a quick sketch or create the precise structure for you. You stay at the speed of thought; the tool supplies the rigour.
Scope of the system
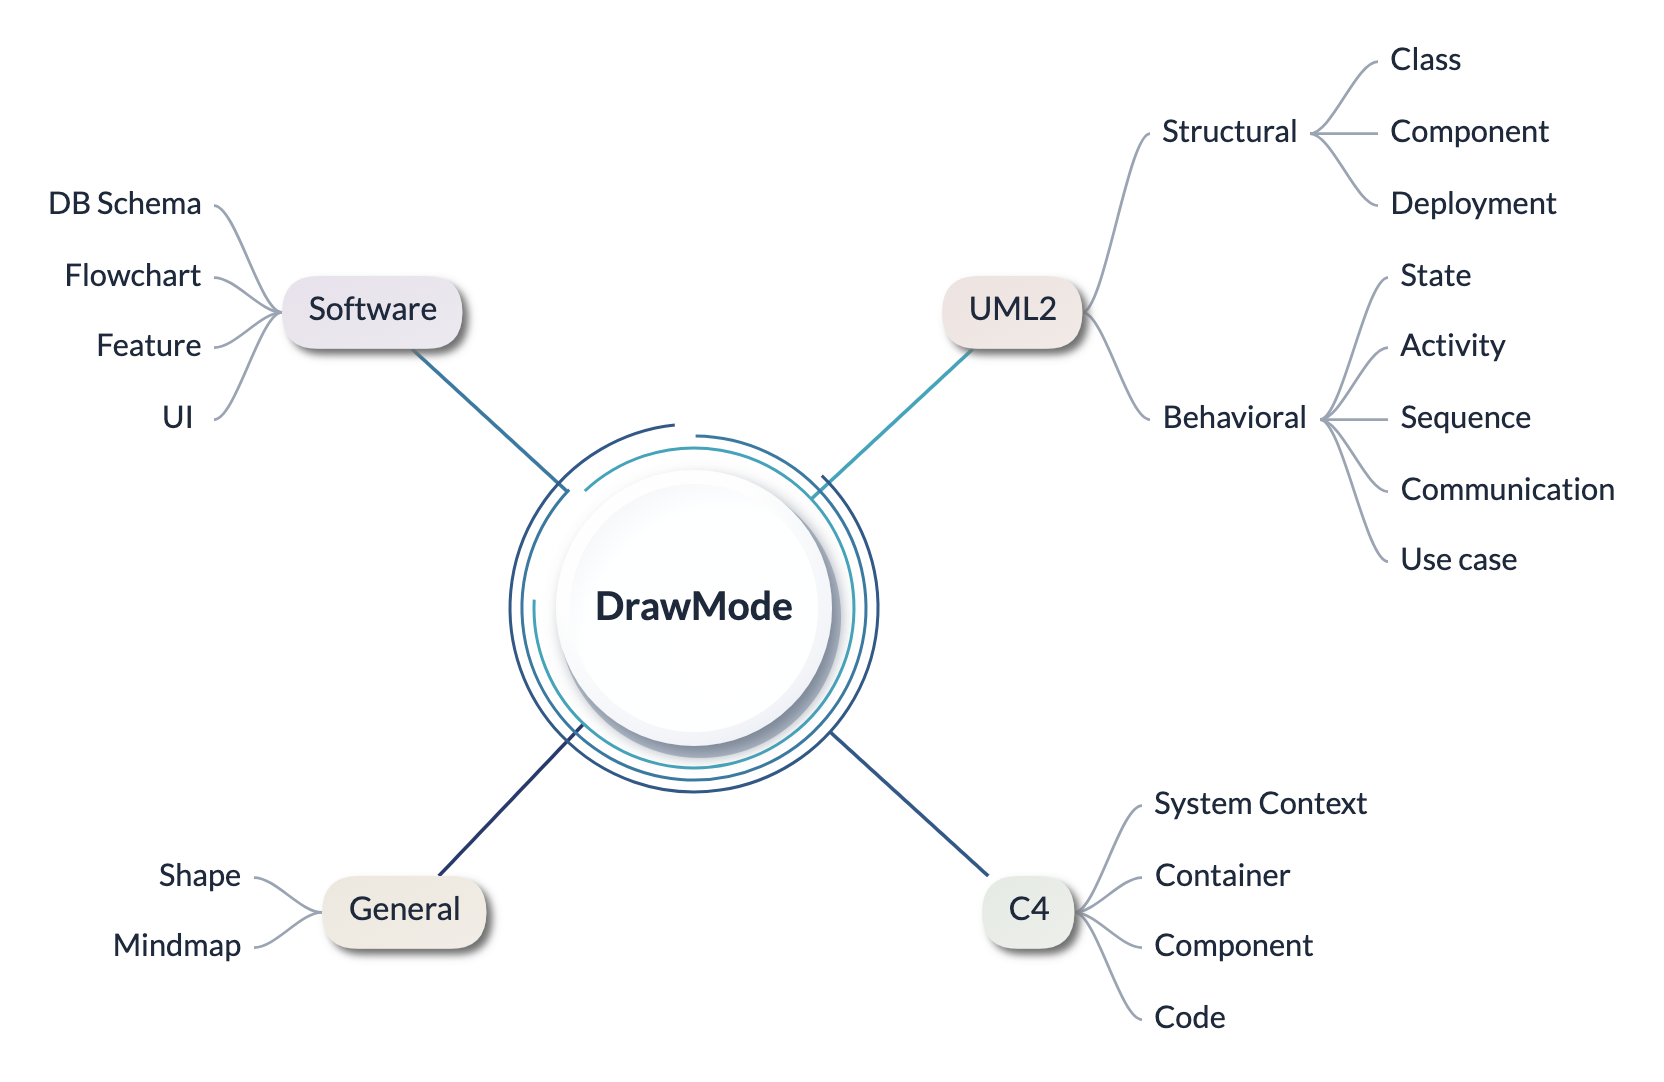
The map below — itself a DrawMode concept map — shows the diagram families the system covers today. General drawing (shapes and mind maps), the UML 2 structural and behavioural diagrams, the four C4 architecture views, and the software family: database schemas, flowcharts, feature models and UI mockups.
- Mind maps, timelines, infographics and card lists — one hierarchical model with interchangeable presentations.
- UML 2 — class, component, deployment, use case, sequence, communication, state machine and activity diagrams.
- C4 architecture — System Context, Container, Component and Code views.
- Software diagrams — database schemas with crow's-foot relationships, flowcharts, feature models and UI mockups.
- AI assistance — create, extend, explain and reverse-engineer diagrams in chat.
- Live team collaboration — shared projects, presence, cursors and chat.
- Clean interchange — export to PNG, JSON, Mermaid, PlantUML and OPML, plus a typed “pure model” of every diagram for downstream tools.
2. Projects, diagrams and gestures
Work lives in projects; a project holds any number of diagrams, its own team chat, and shared variables. The Projects menu in the header creates, opens and shares projects; Add Diagram creates a diagram and asks for its starting category. A new canvas opens with a setup card from which you can rename the diagram, pick the category, or hand the empty page to the AI.
The Shift gesture
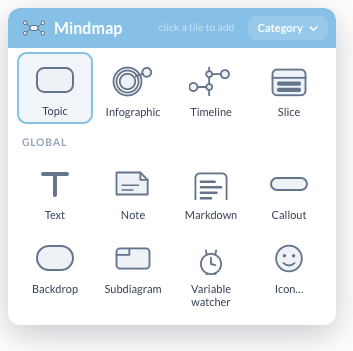
The fastest way to draw is the Shift palette. Hold Shift with the pointer over empty canvas and a grid of creation tiles appears under the cursor — the shapes of the diagram's current category, plus a Global row (text, notes, markdown, callouts, backdrops, subdiagrams, the variable watcher and icons) that is available everywhere. Release on a tile to drop that shape where you began the gesture.
Hold Shift over a shape and the grid becomes shape-specific: the links that can leave it and the additions that make sense on it. Release on a link tile and drag to the target to connect; release on an add tile to create a connected neighbour — for a mind-map topic, a sibling or a child.
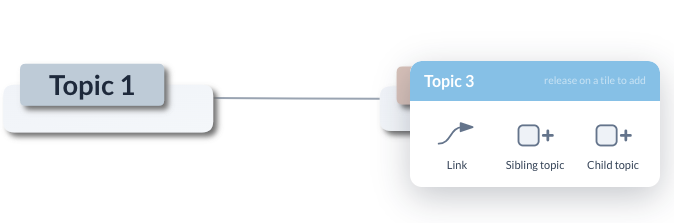
The Category button in the grid's header switches the canvas to another category — the same page can mix them freely, so a class model, a mind map and a few free shapes can sit side by side while you think something through. The right-click menu offers everything else: editing, colours, ordering, export and the same category switch.
Navigating the canvas
- Pan by dragging empty canvas (or hold Space and drag anywhere).
- Zoom with the − / 100% / + controls or a pinch; Fit frames the whole diagram, or the selection if there is one.
- The minimap in the corner shows the whole diagram and drags you around large pages.
- Enter renames the selected shape in place; Tab adds a child topic on a mind map.
- ⌘-click builds a multi-selection; arrow keys nudge for pixel-exact placement.
- ⌘Z / ⇧⌘Z undo and redo your own edits — including AI edits and auto-layouts.
Mind maps in DrawMode are simply hierarchical structures with interchangeable presentations — the same topic tree can render as a classic map, an infographic, a timeline or a compact card. And because a page can hold many top-level structures at once — several lists, a map, loose shapes, a few classes — it makes a fine brainstorming surface long before anything is formal.
Alignment guides
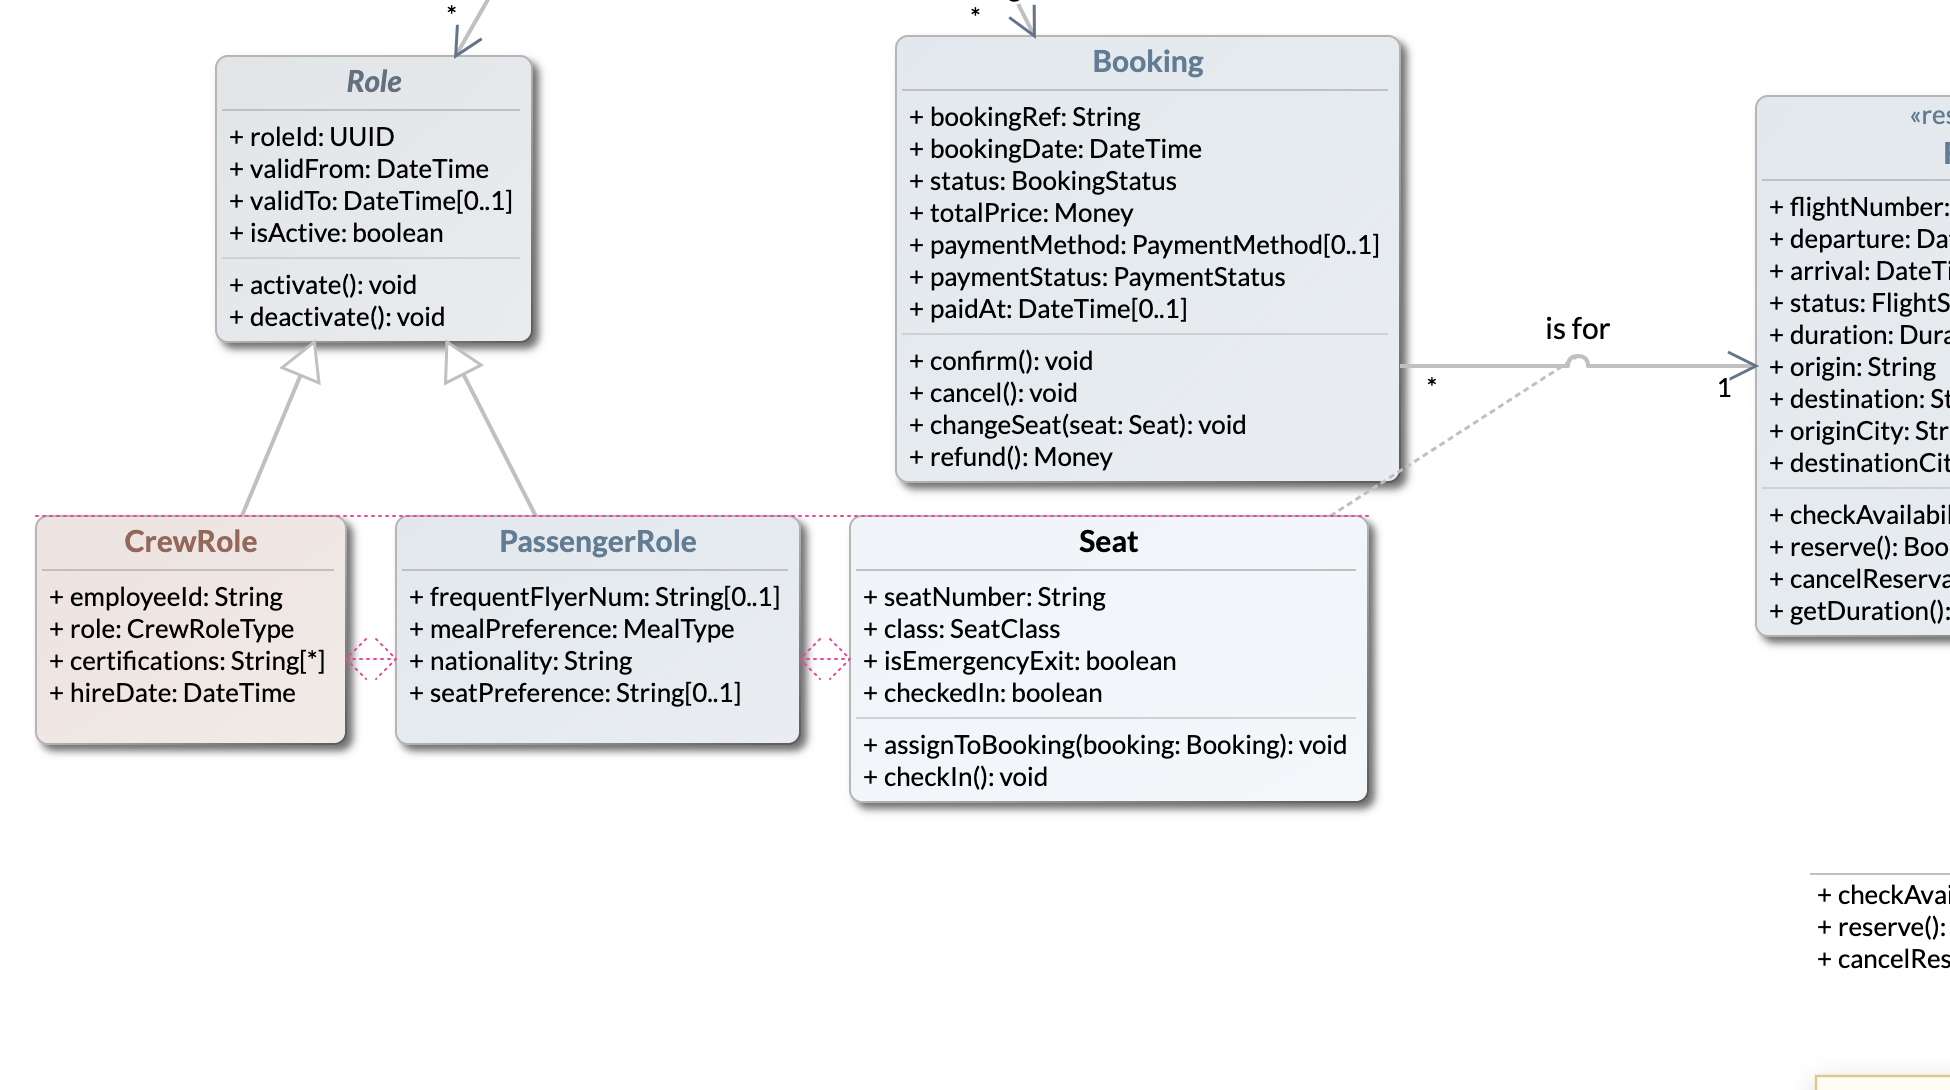
Hand-placed shapes get a soft magnet: while you drag, the shape's top edge catches a neighbour's top within about 20 pixels (align-to-row) and its left edge catches another neighbour's left (align-to-column). An axis that catches draws a finely dotted pink guide spanning both shapes — a horizontal line for a row catch, a vertical line for a column catch. With one axis locked, sliding along the other snaps to reproduce a neighbour's gap, and double-headed spacing arrows mark the two equal gaps. The catch is deliberately gentle — outside the catch range the drag is free, and the arrow keys nudge without any snapping. Auto-arranged nodes (mind-map topics that re-slot into their tree) don't take part.
3. Tutorial 1 — a simple class diagram
This tutorial walks the Class diagram in the user-manuals project — a domain model for a flight reservation system. Open it and follow along on the real thing; every technique below was used to draw it.
Adding classes, shapes and notes
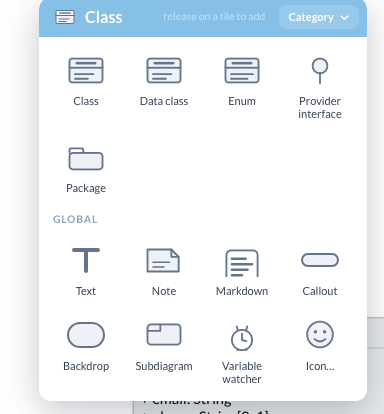
With the canvas in the Class category, hold Shift over empty canvas and the grid offers the category's elements — class, data class, enum, provider interface and package — plus the Global row for notes and free shapes.
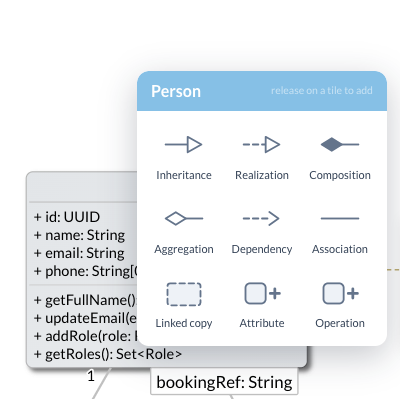
Hold Shift over a class and the grid switches to what can hang off it: the six UML relationships — inheritance, realization, composition, aggregation, dependency, association — plus a linked copy, and in-place additions for attributes and operations. Release on a relationship tile and drag to the target class; release on Attribute or Operation to append a row and type its signature.
Names, attributes and operations all edit in place — click a row (or press Enter on the selection) and type; name: Type[0..1] style signatures are understood. Notes come from the Global row and attach to any element with a note link.
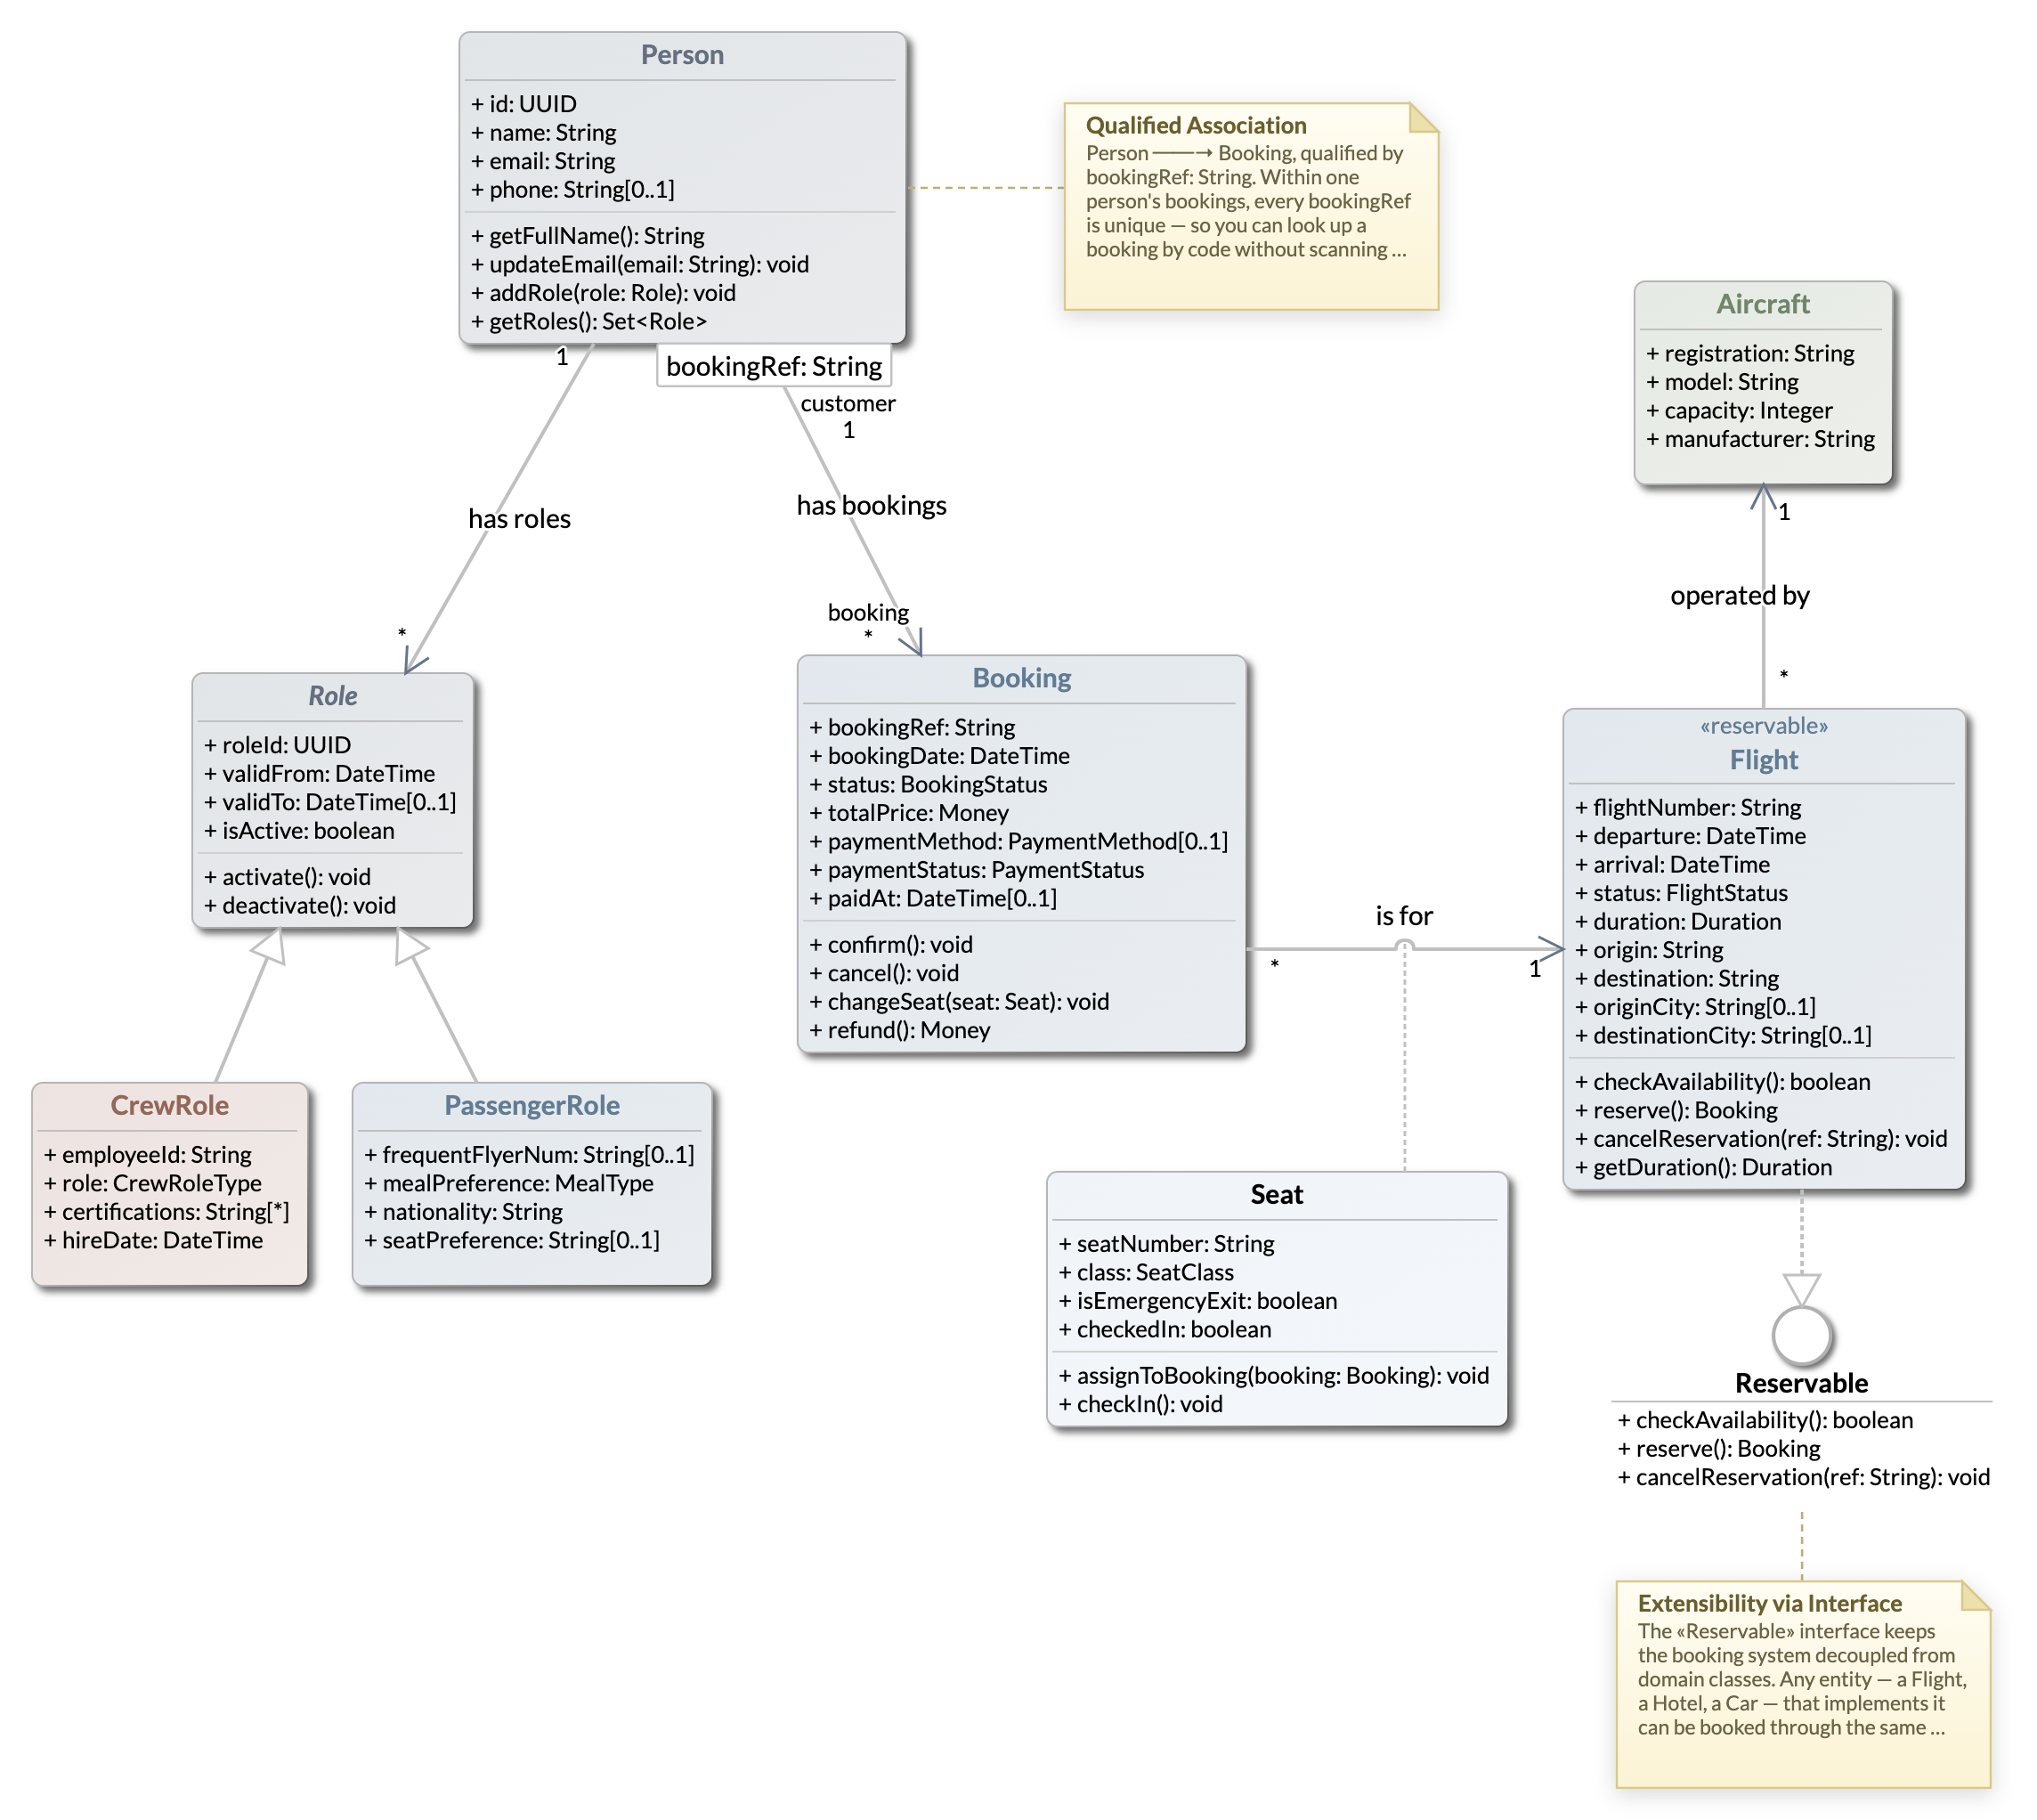
Reading the result: Person owns a set of Roles (the abstract class renders its name in italics) specialised into CrewRole and PassengerRole; Booking links passengers to Flights, each operated by an Aircraft; Seat hangs off Booking through an association class on is for. Association ends carry their names and multiplicities (1, *, 0..1) as stacked labels.
Linked copies
The Linked copy tile (on the class and interface Shift grids) creates a second rendering of the same classifier whose name stays linked — rename the original and every copy follows. Use copies to repeat a busy class on another part of the page (or another diagram view) so relationships fan out locally instead of hauling long lines across the model.
Interfaces three ways
An interface can render as a box (a full classifier with operation rows), a circle (the classic lollipop ball — compact, for when the fact of the contract matters more than its contents), or a socket (the required half-moon). Flip between them from the interface's options menu; provided and required wiring against components uses the ball-and-socket forms naturally.
Qualified associations and association classes
The Person → Booking association carries a qualifier — the small box holding bookingRef: String at the Person end: within one person's bookings every bookingRef is unique, so a booking can be looked up by code without scanning. The is for association to Seat is an association class — the dashed line ties the Seat classifier to the association itself, holding the data that belongs to the pair. Both come from the association's options menu.
Export and auto-layout
Export ▸ PNG downloads the diagram as an image — the whole page, or any subdiagram region on its own. Auto-layout (in the arrange menu) runs a proper layered layout over the whole diagram, or over just the current selection when you want one cluster tidied without disturbing hand-placed work. Auto-layout is a normal edit: one ⌘Z puts everything back.
4. Tutorial 2 — mind maps, timelines and cards
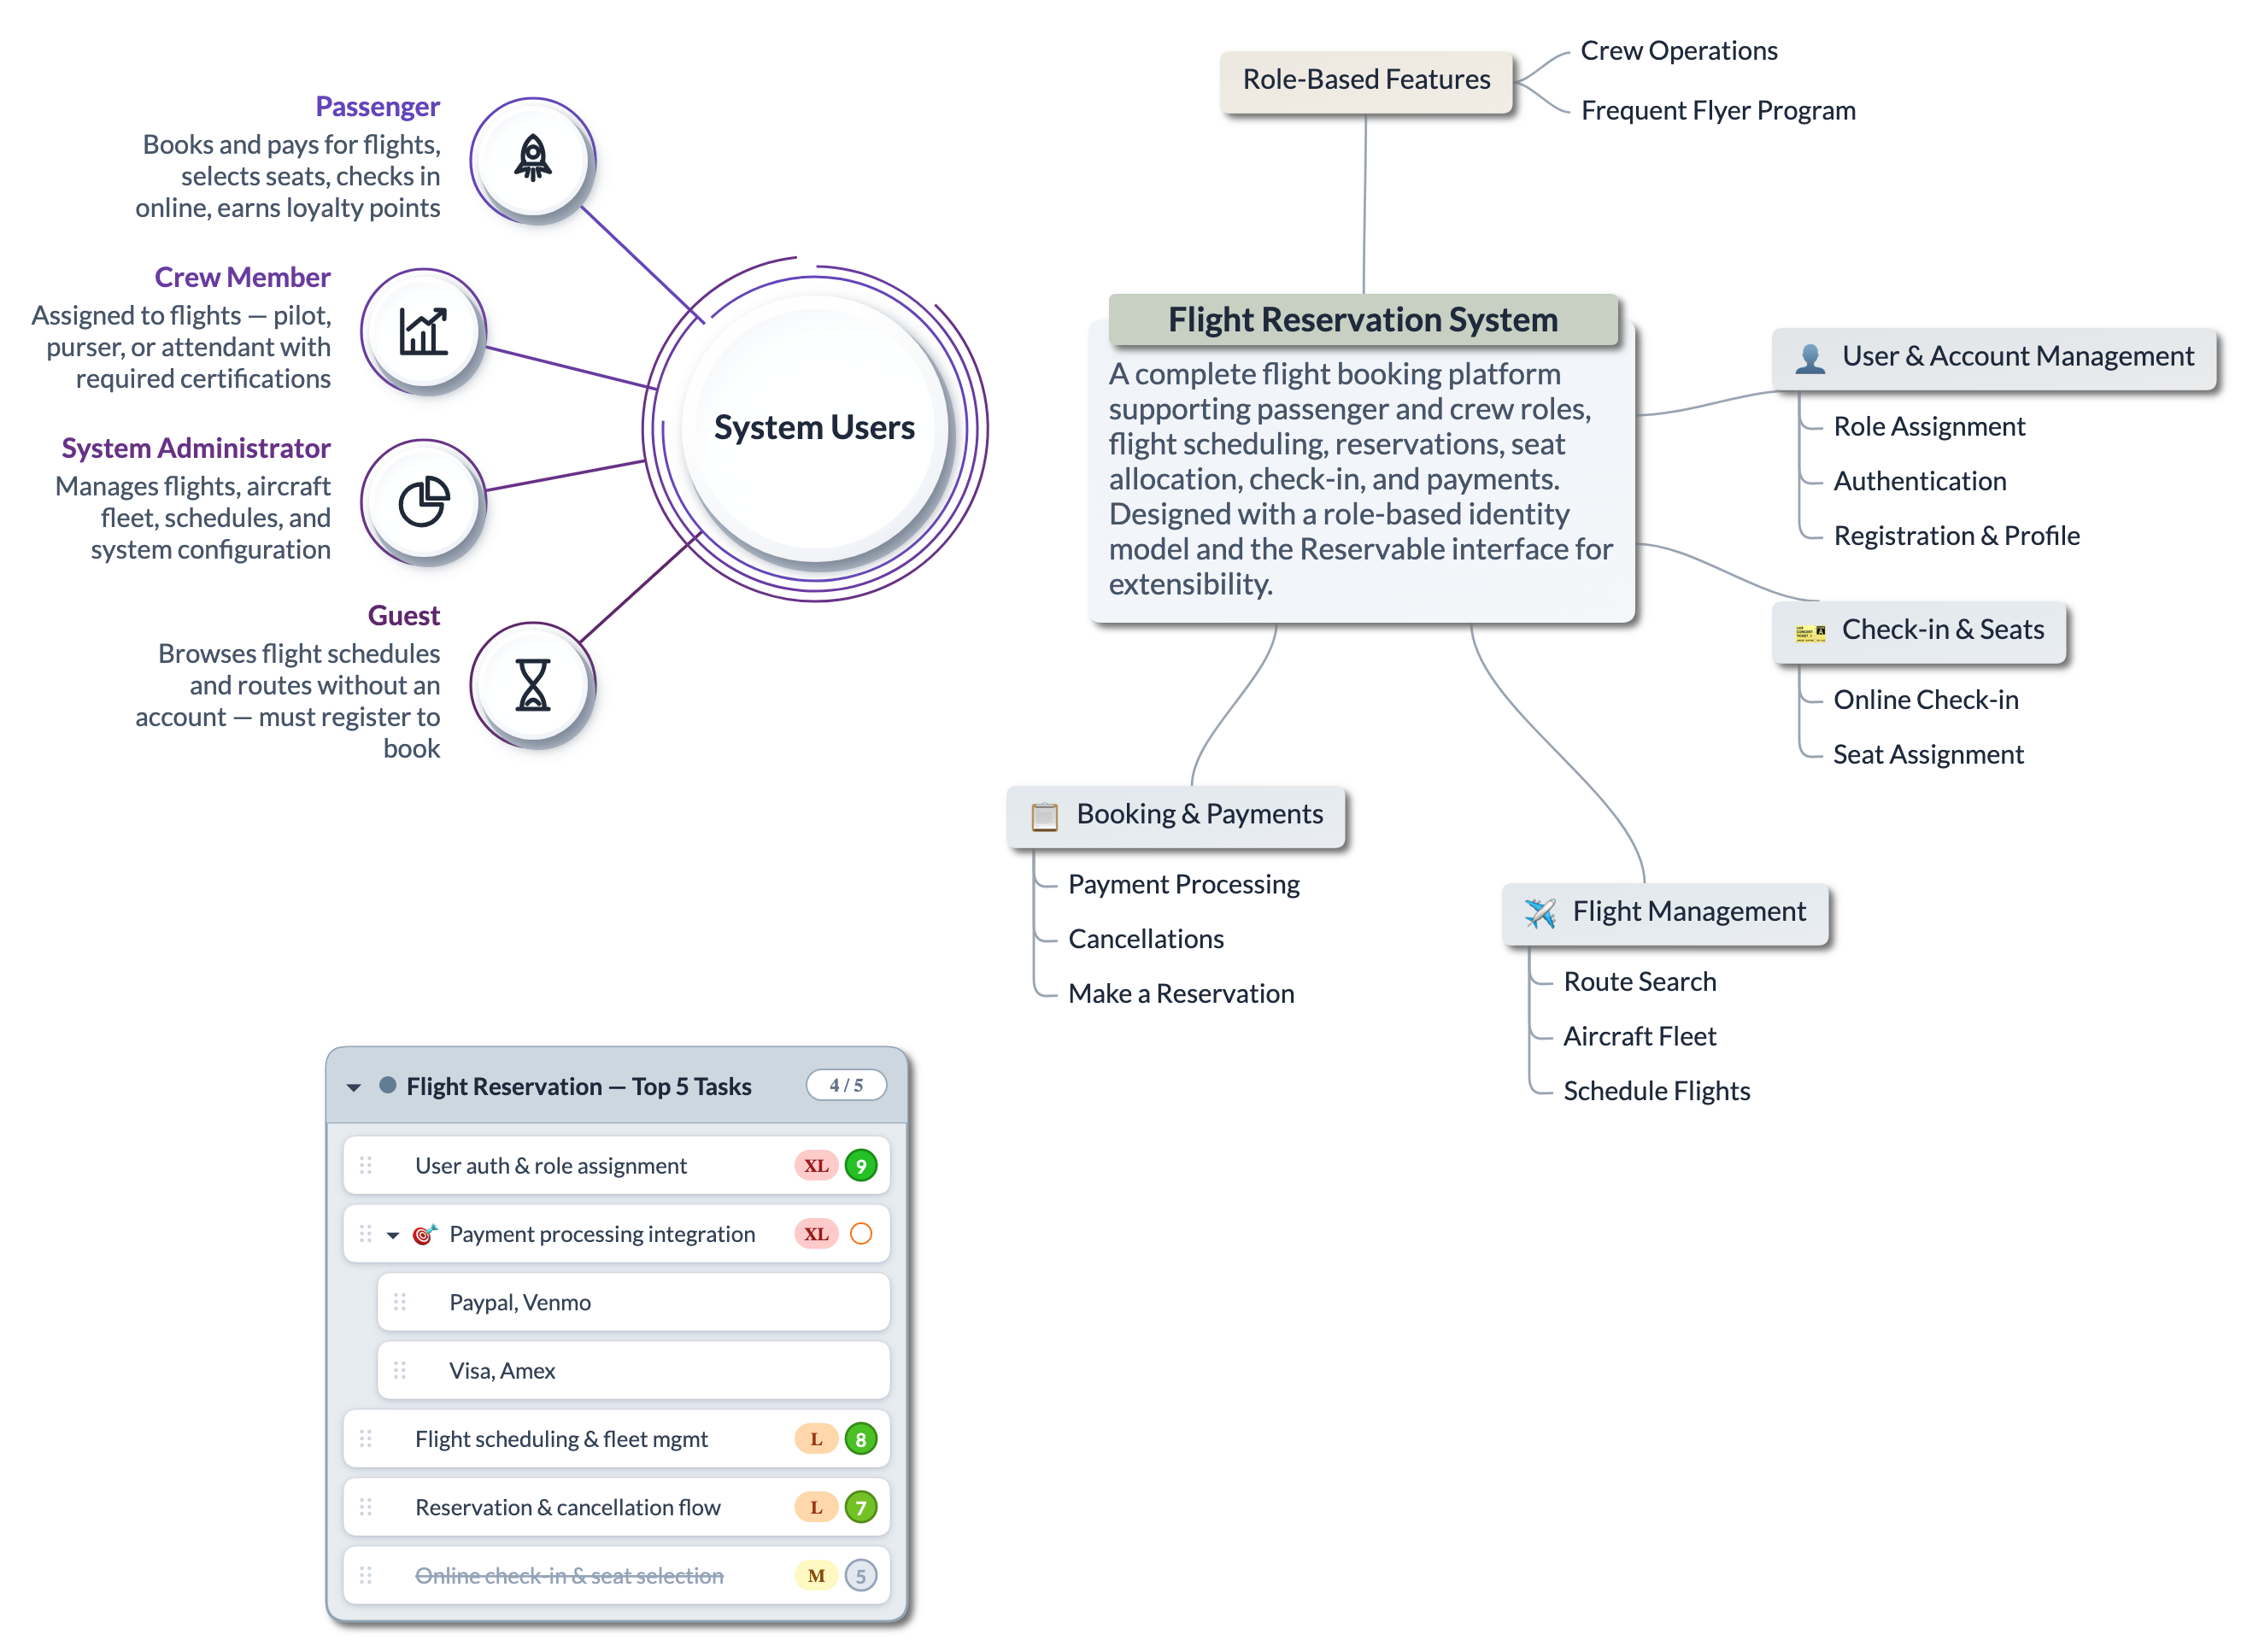
This tutorial uses the Mindmap and Timeline (vertical) diagrams from the project. The mind-map page holds three separate structures at once — a classic map, an infographic and a to-do card — which is itself the first lesson: top-level topics are cheap, and one page can carry a whole thinking session.
To-do lists
The Top 5 Tasks card is an ordinary topic tree wearing the slice presentation: the root is the card header, each subtopic a row, hierarchy shown by indentation (payment methods nest under Payment processing integration). Rows carry optional priority chips (XL/L/M), weight discs, and a live done / total counter in the header; strikethrough marks a completed row. Keep several lists as separate top-level concepts and drag rows between them.
Timelines
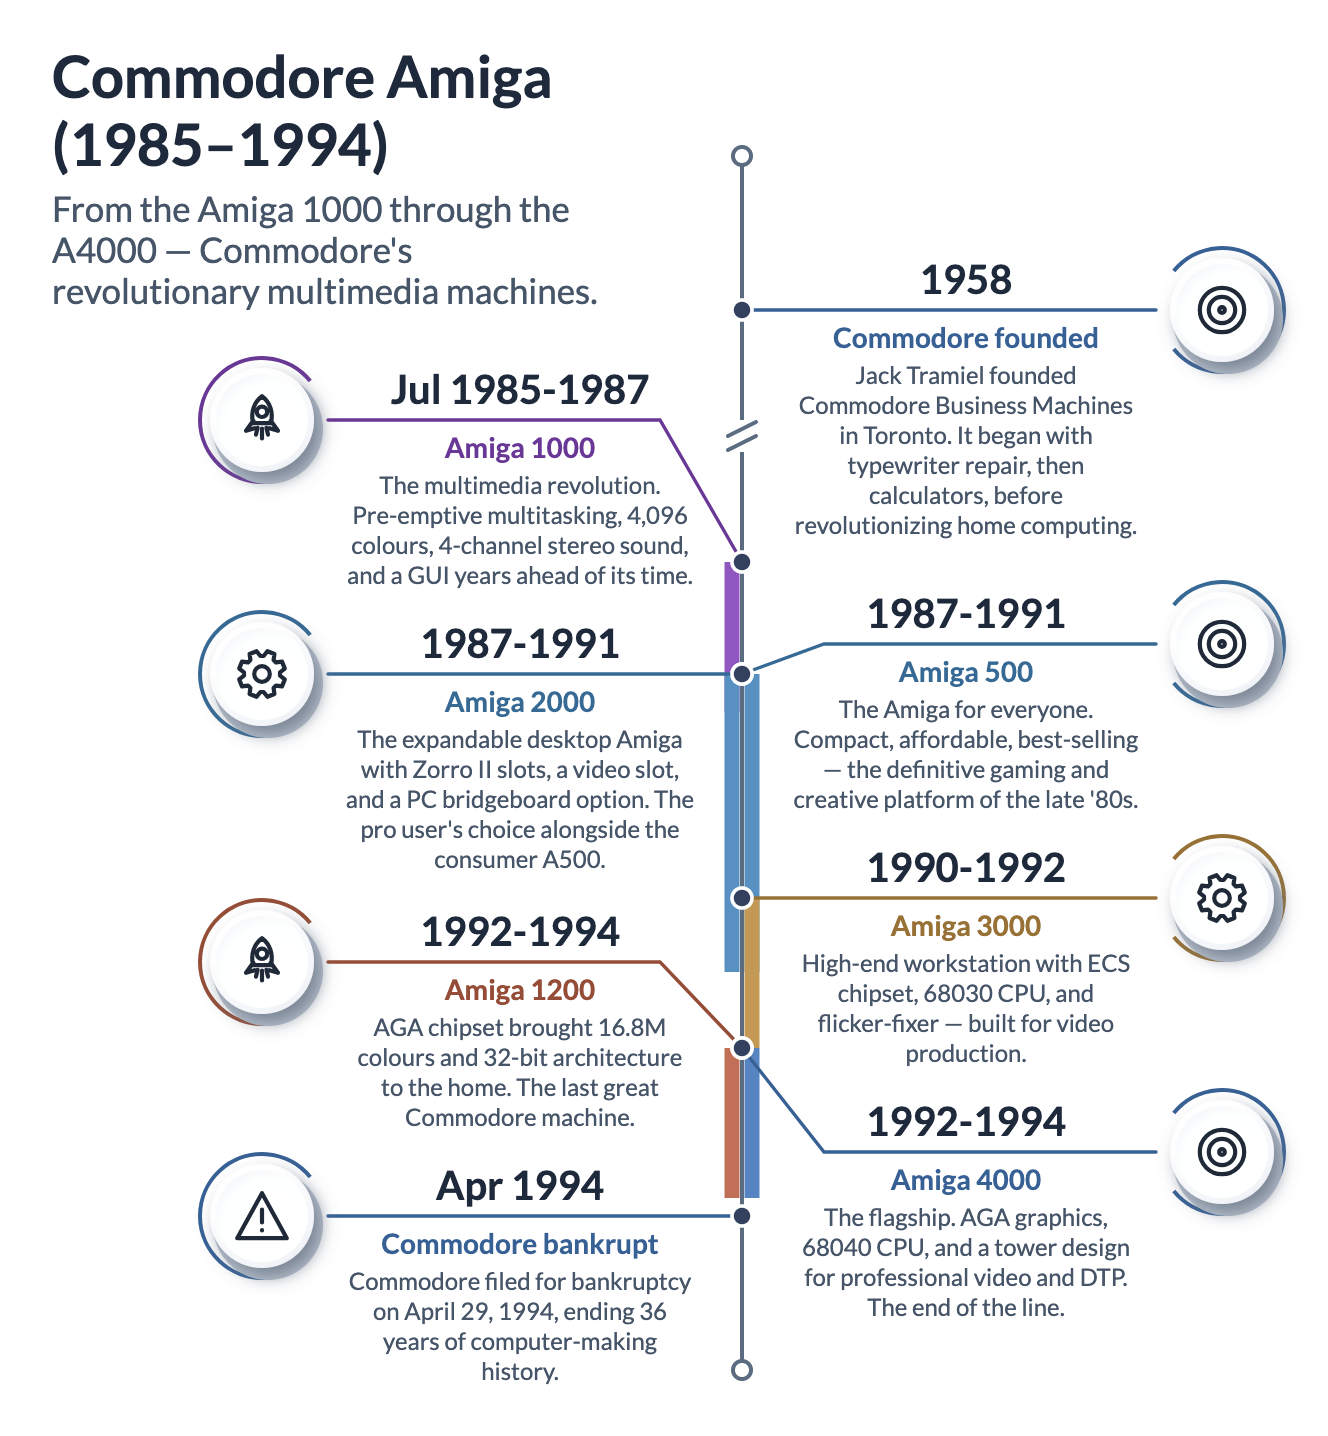
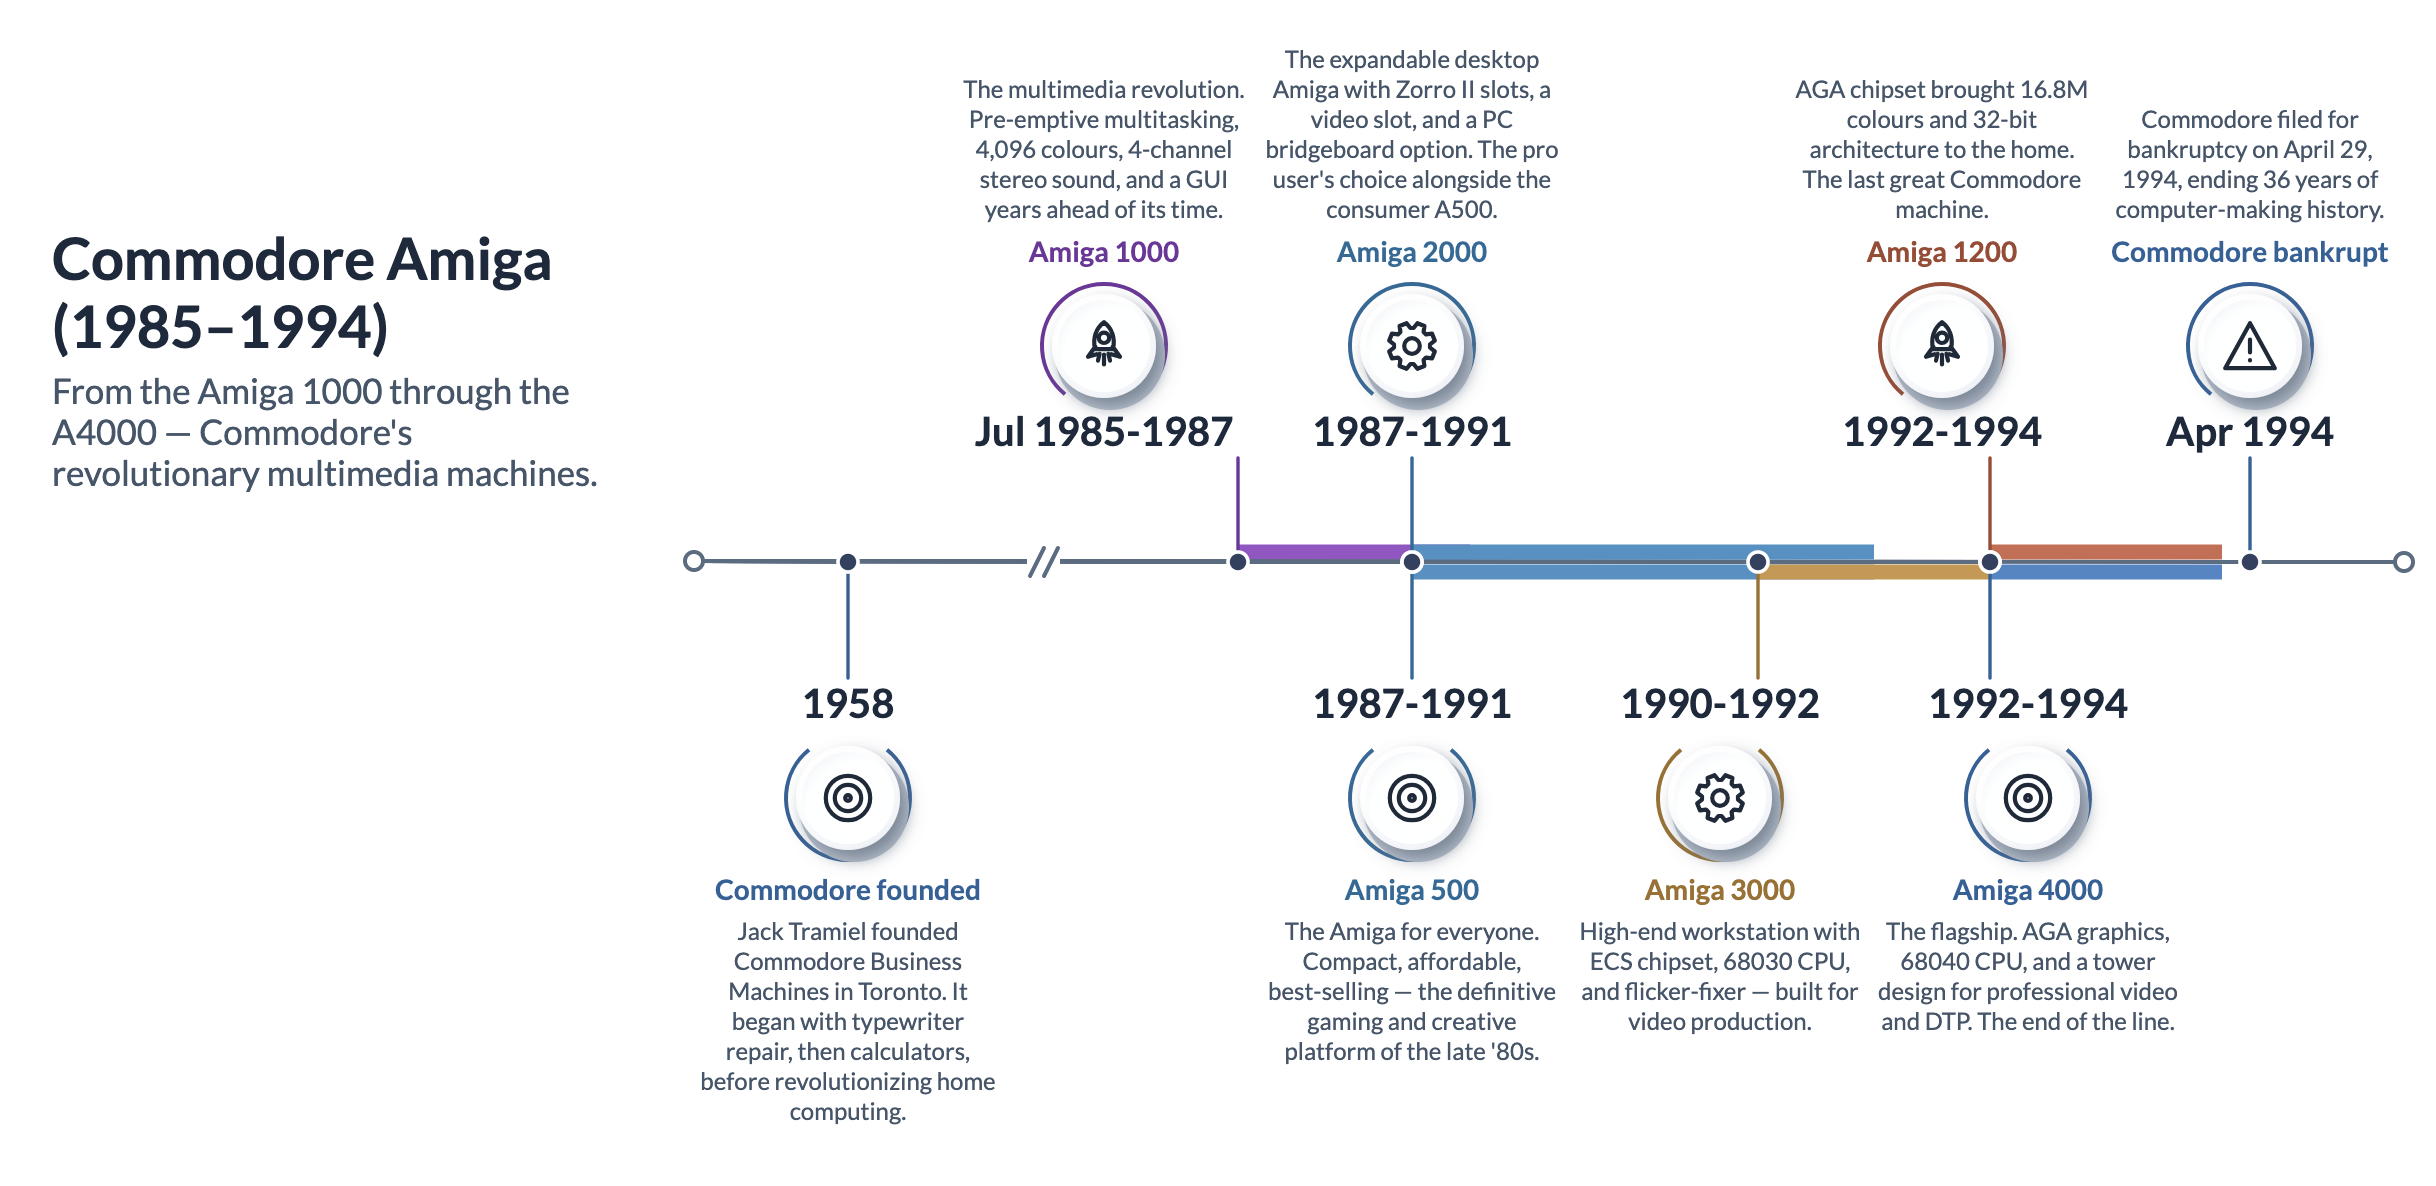
A timeline is the same topic tree again, presented against a time axis. Start each entry's title with its year, date or range (Jul 1985-1987 Amiga 1000) and entries order and space themselves chronologically along the spine — a range shows a tinted duration bar beside the spine, long empty stretches are cut out with a marked break, and entries alternate sides down (or, in the horizontal layout, across) the line. Undated maps can lead with plain order numbers instead.
Infographics
The infographic presentation renders the root as a 3D-shaded disc wearing one accent ring per subtopic; each subtopic gets a smaller disc with a line-art glyph (rocket for launch, gear for process, hourglass for time…) and its description beside it. It turns a plain hierarchy into something you can put in front of stakeholders without redrawing it.
Cards
The slice presentation used by the to-do list is general-purpose: any subtree can become a compact card — a titled header plus indented rows with optional priority, weight and date fields — handy for backlogs, checklists and “top N” summaries beside richer diagrams.
AI creation
All of these are one prompt away: ask the assistant for “a mind map of the flight reservation system's functionality” or “a timeline of Commodore computers, 1977–1994” and it builds the structure directly on the canvas — then restyle it with a presentation word (“make it a timeline”, “as an infographic”) or extend it by hand. AI edits arrive as ordinary edits: inspect, adjust, or ⌘Z.
5. UML diagrams
UML remains the shared vocabulary for describing software structure and behaviour — boxes-and-lines everyone already reads, with just enough formality that a diagram can double as a specification. DrawMode covers the working set: three structural and five behavioural diagram types, drawn with the same low-friction gestures as everything else.
One deliberate simplification: class and component are a single classifier family. A classifier can render as a class or a component, carry attributes and operations, realize interfaces, and — through the Advanced menu — open up with parts, ports and delegation. So the Class category also covers package diagrams (the package shape) and, with components, composite structure diagrams; interfaces and enums are their own elements shared by both.
Class diagram
The structural backbone: classes, attributes, operations and the six UML relationships, plus interfaces, qualified associations, association classes and notes — see Tutorial 1 for the walk-through.
Component diagram
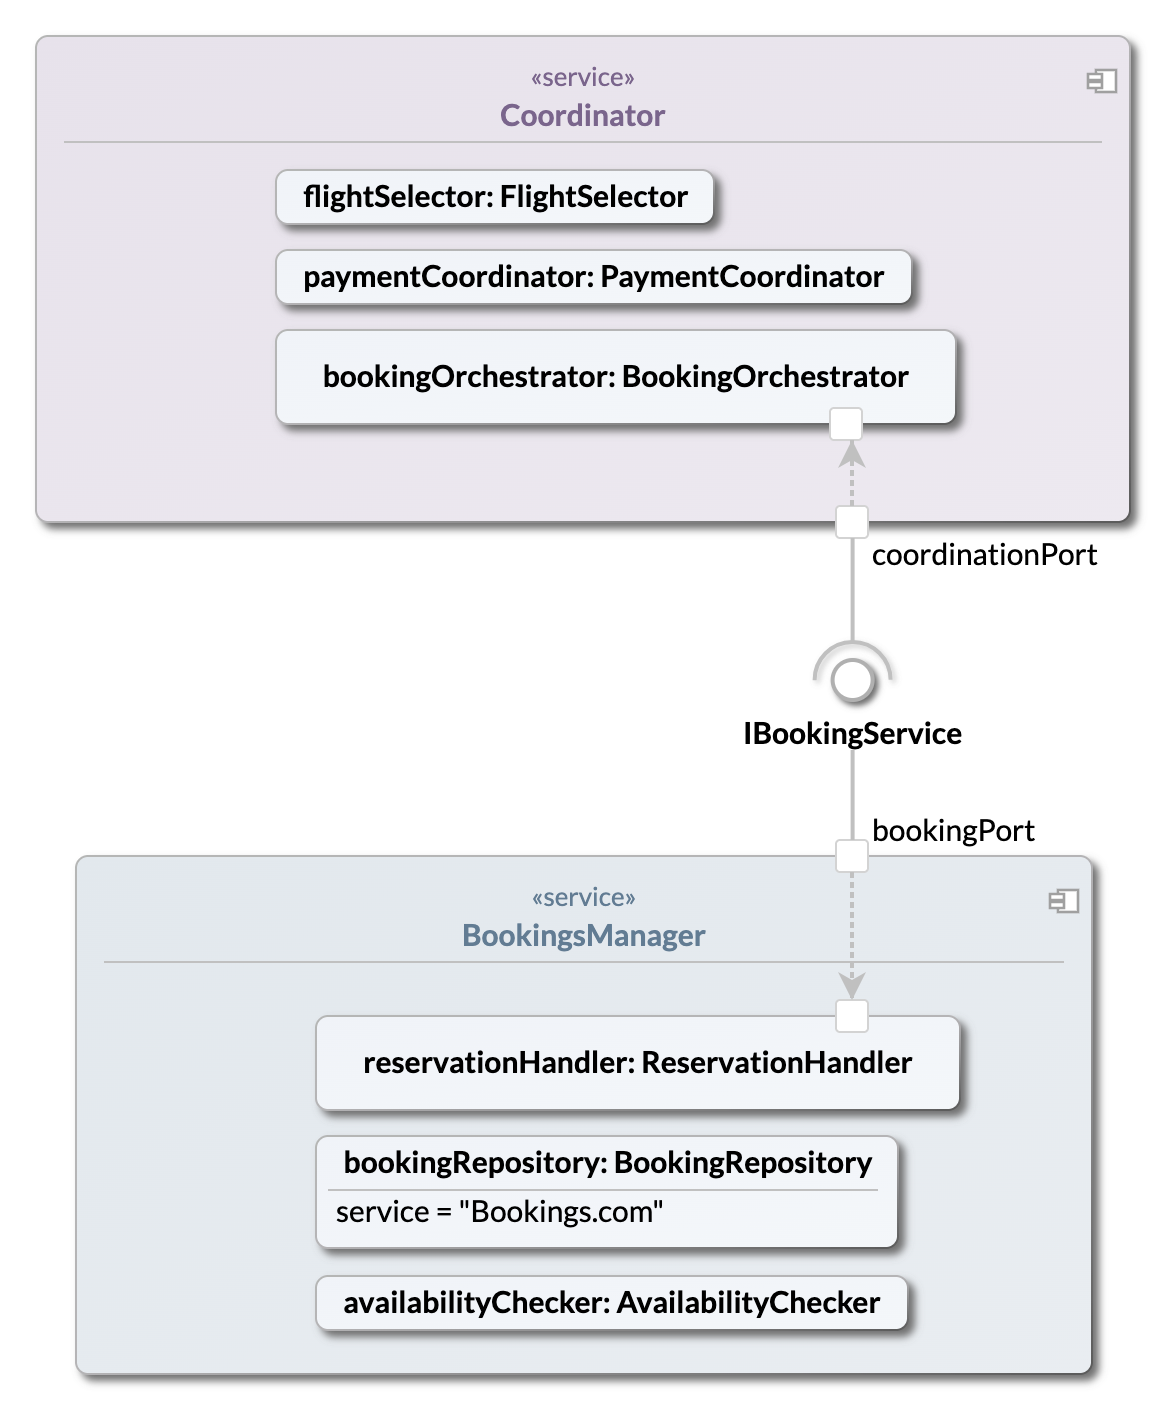
How the system splits into replaceable pieces and the contracts between them. Two composite classifiers — Coordinator and BookingsManager — each expose a border port delegating to internal parts; the ball-and-socket pair through IBookingService wires the required side to the provided side.
Deployment diagram
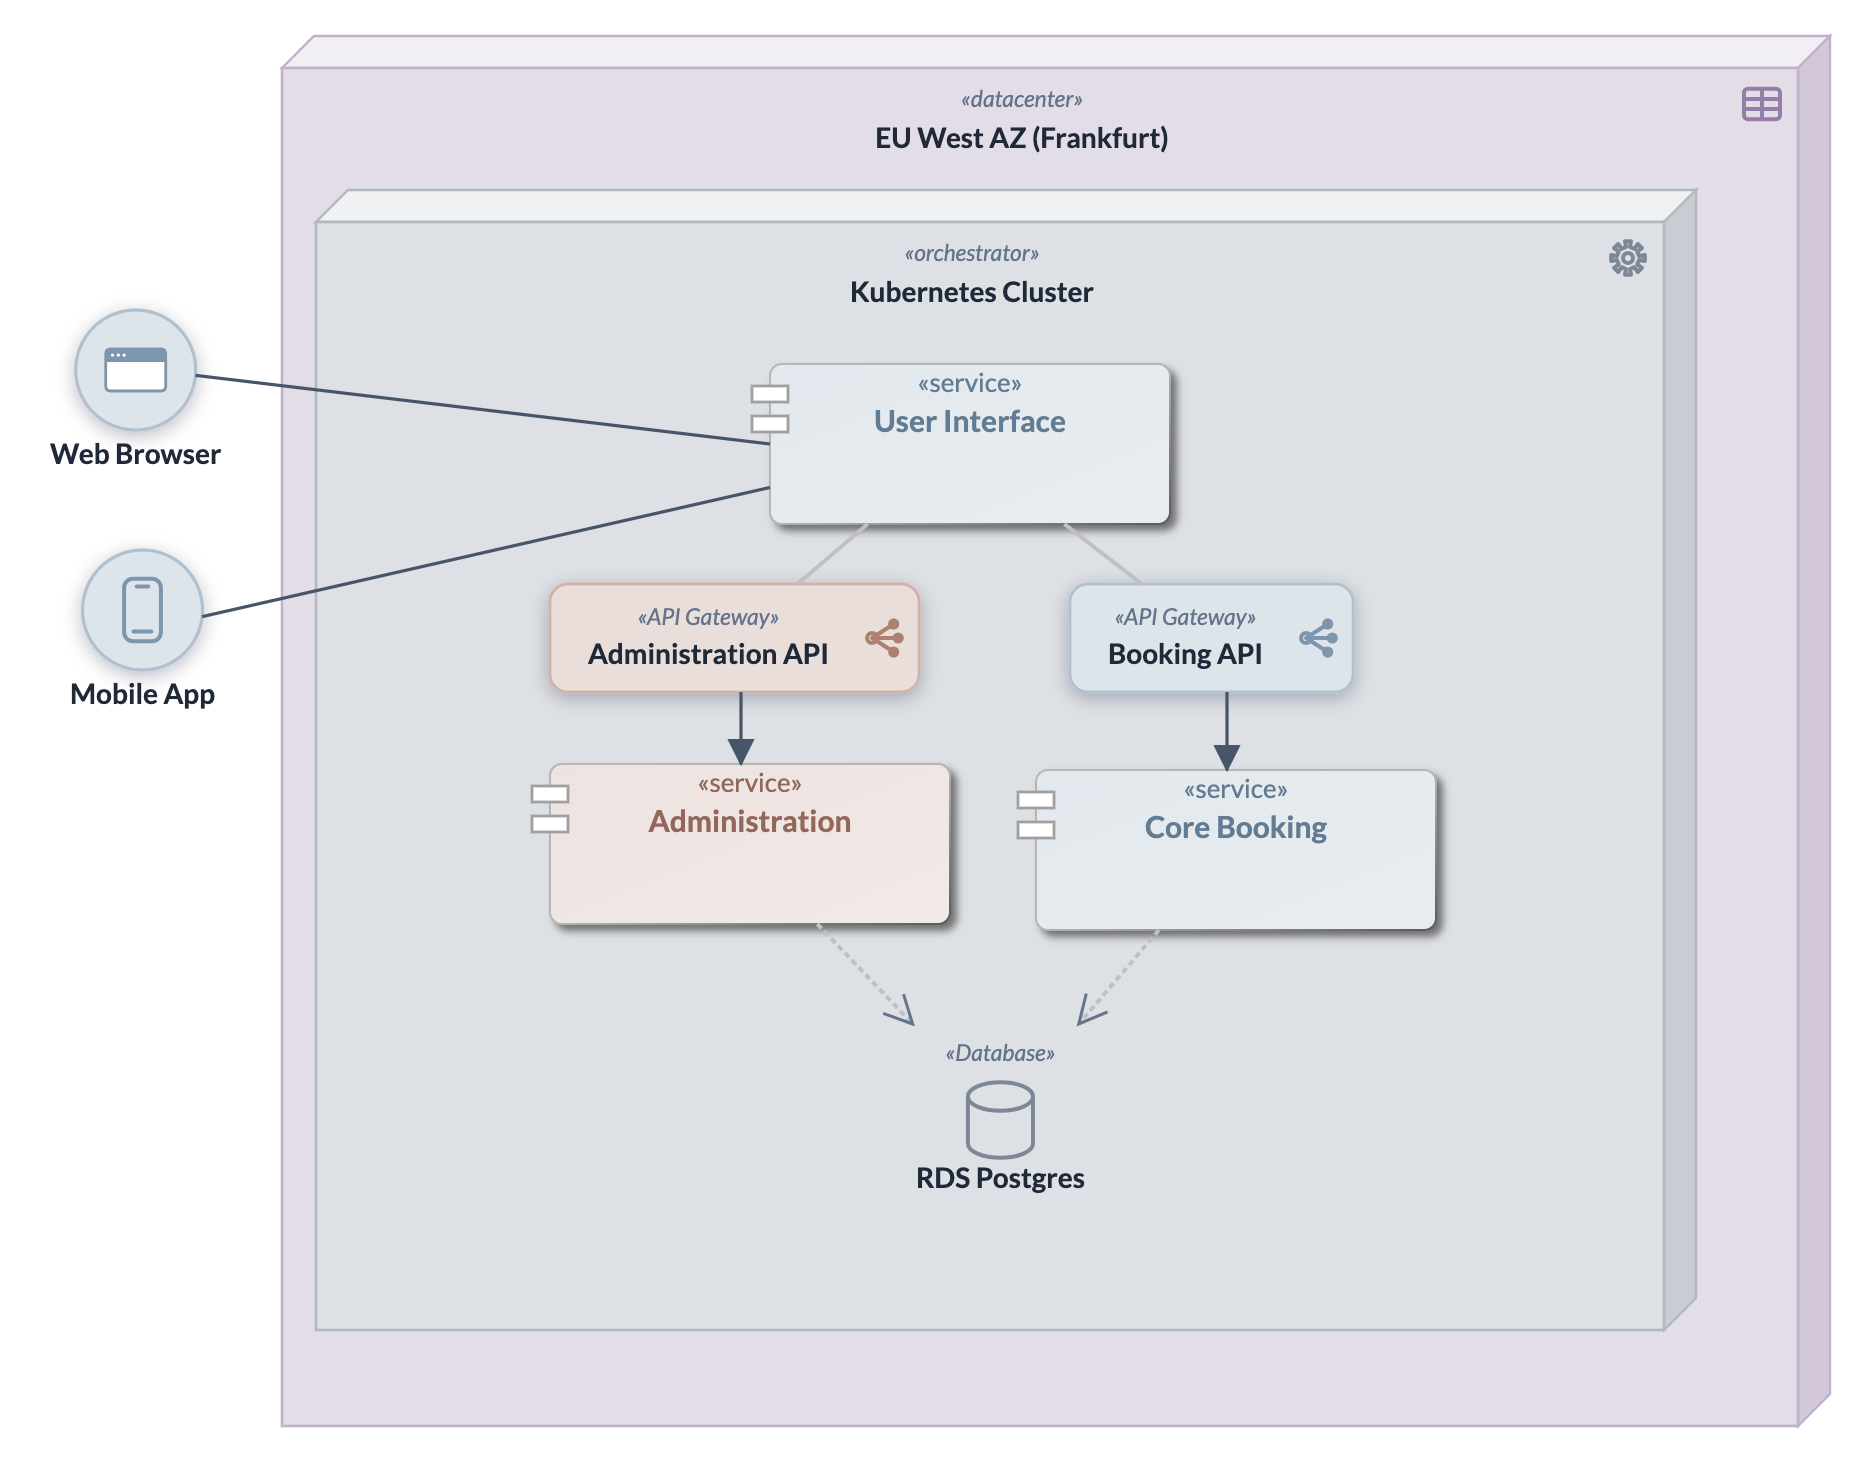
Where the software runs. Three-dimensional nodes nest to show the execution environment — a Kubernetes cluster inside the Frankfurt availability zone — hosting UI, Core Booking and Administration components beside infrastructure elements (the two APIs and RDS Postgres). Client devices connect over communication paths; dependencies and associations show who talks to whom inside the cluster.
Use case diagram
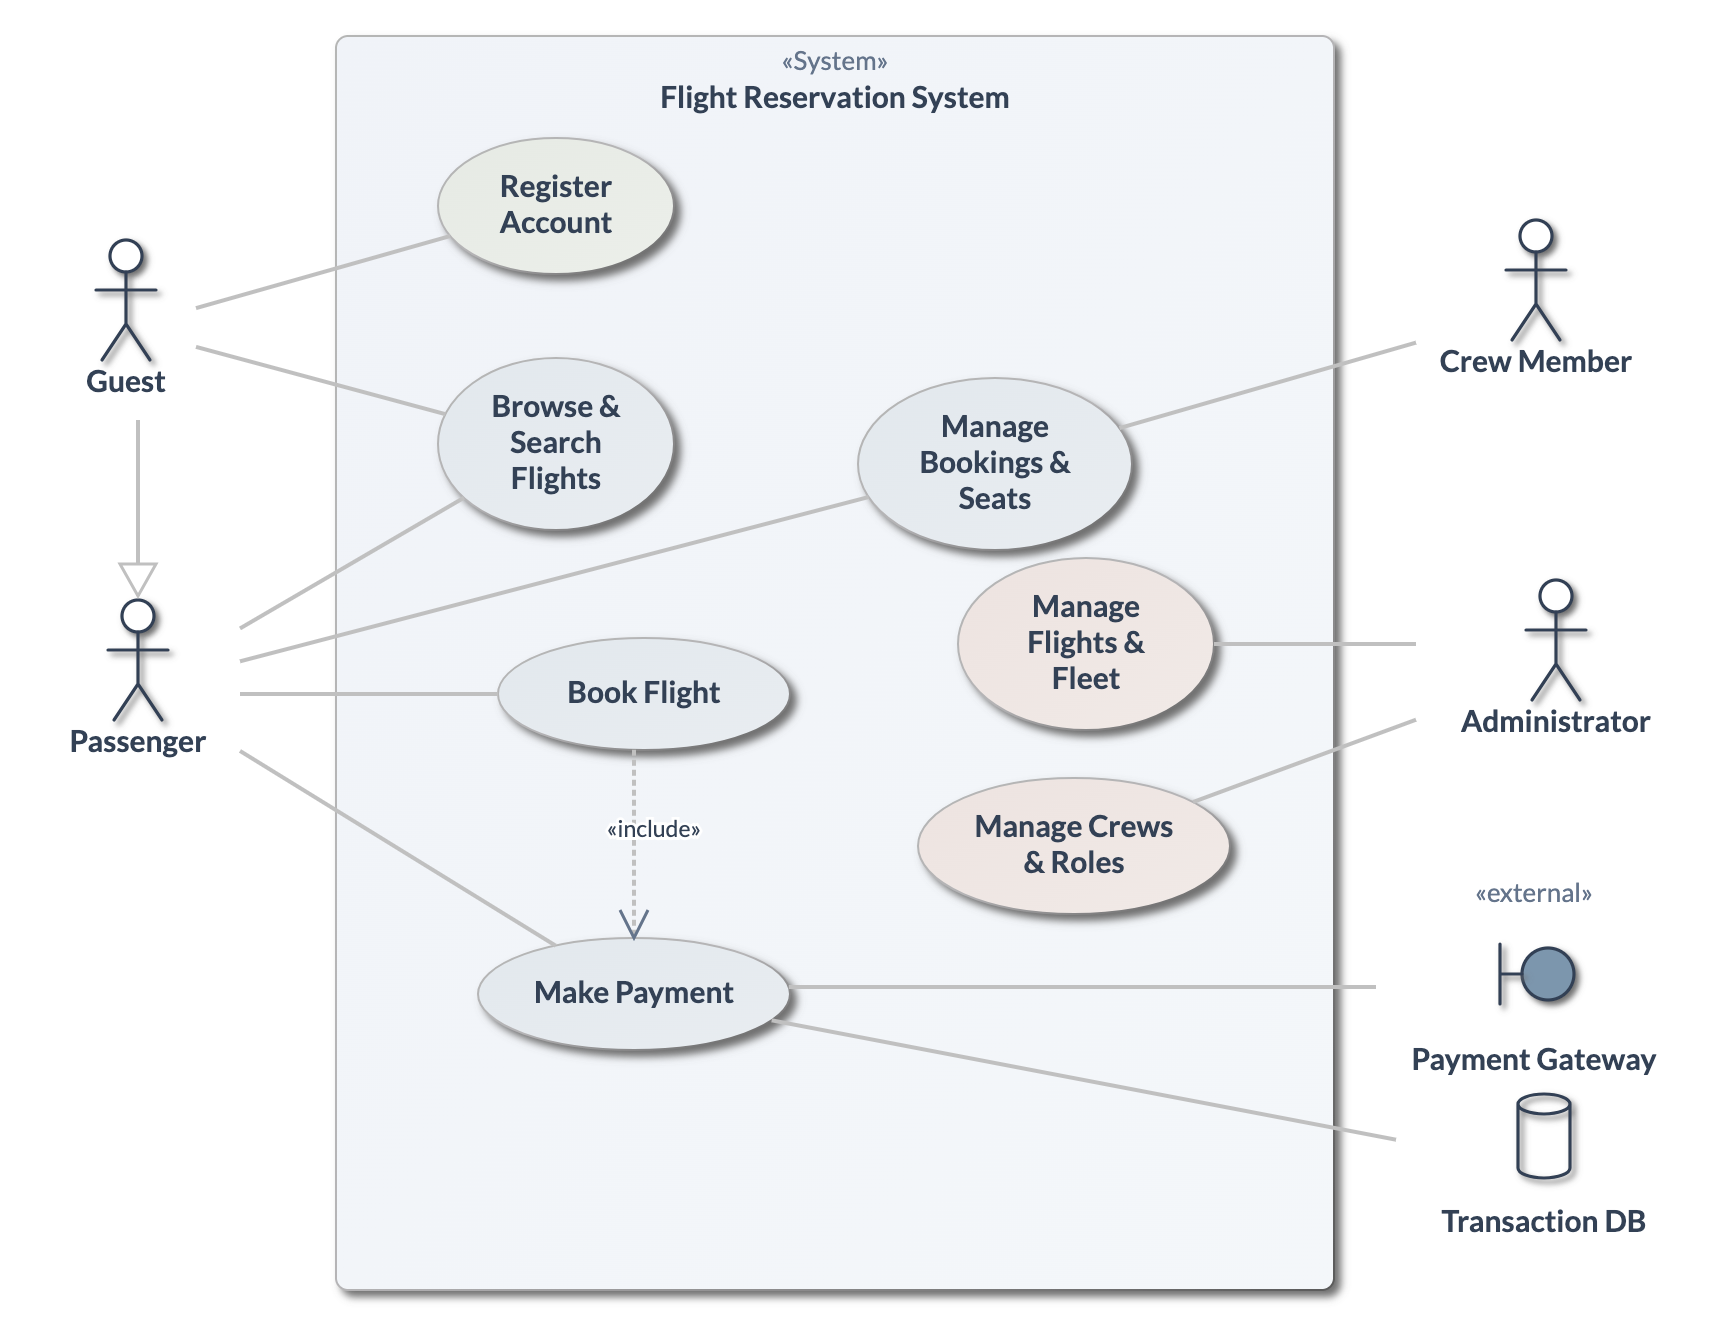
What the system is for, and for whom. The subject boundary holds the use cases; actors stand outside it. Actor generalization lets Passenger inherit what Guest can do; the Payment Gateway and Transaction DB appear as secondary (system) actors on the right.
Sequence diagram
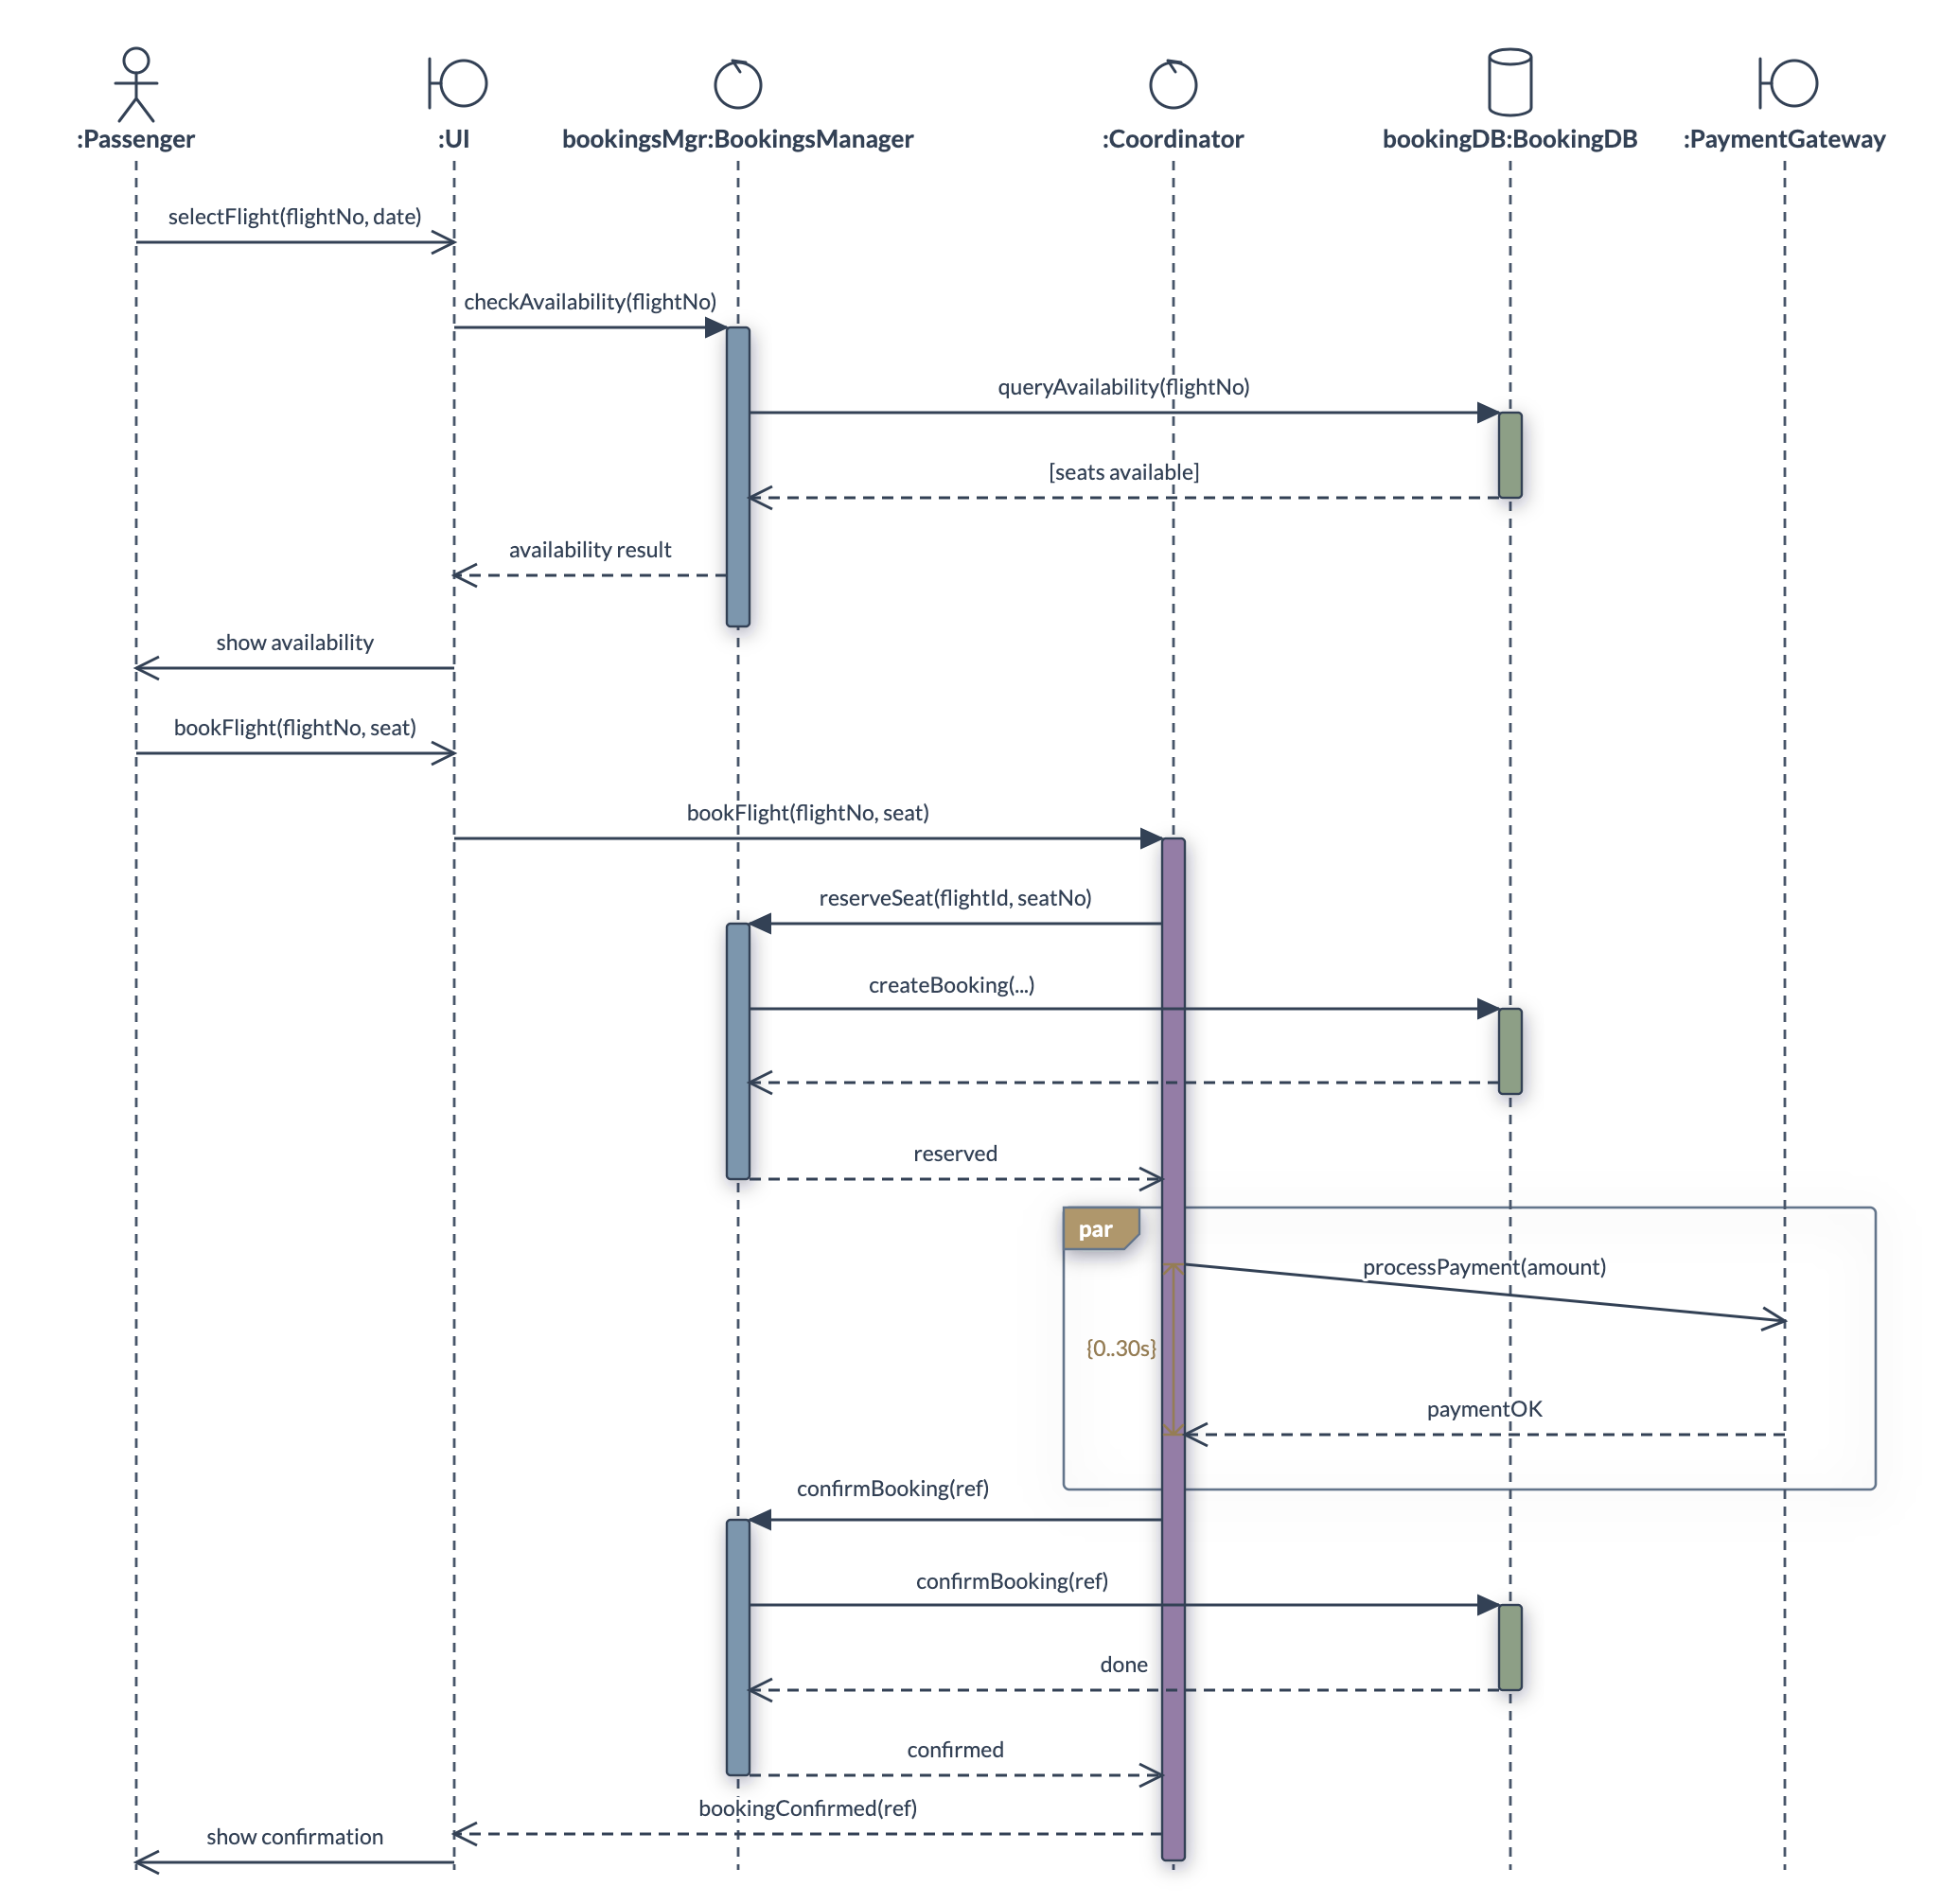
One scenario over time. Lifelines (with per-kind heads — actor, boundary, control, entity, database) drop execution bars where they're active; bars nest for re-entrant calls. Solid arrows are synchronous calls, open arrows asynchronous signals, dashed arrows replies. A fragment frames the availability check, and the {0..30s} timing constraint bounds how long payment may take.
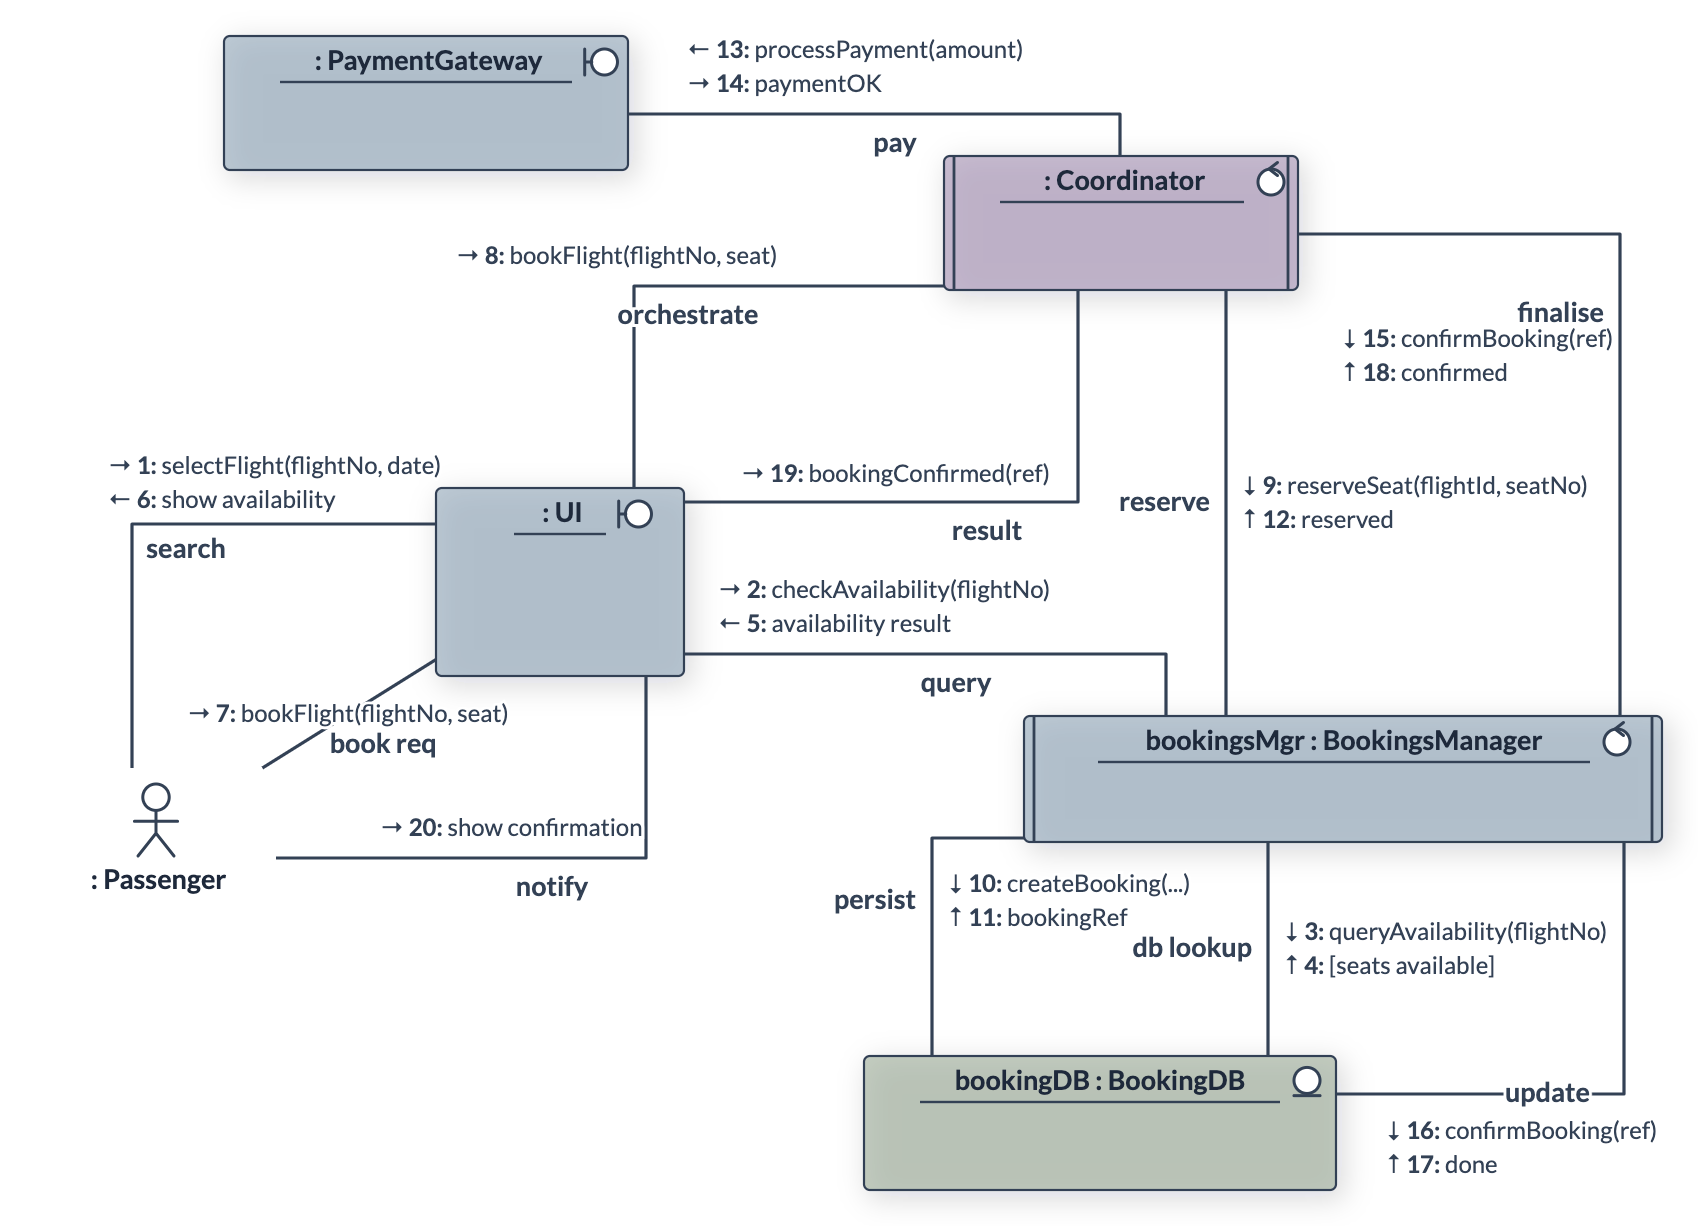
Communication diagram
The same interactions, arranged by structure instead of time. Objects connect by links; each message rides a link with a sequence number (1, 1.1, 2.1…) and a direction arrow, so the call order can be reconstructed while the layout stays free to mirror the architecture.
State machine diagram
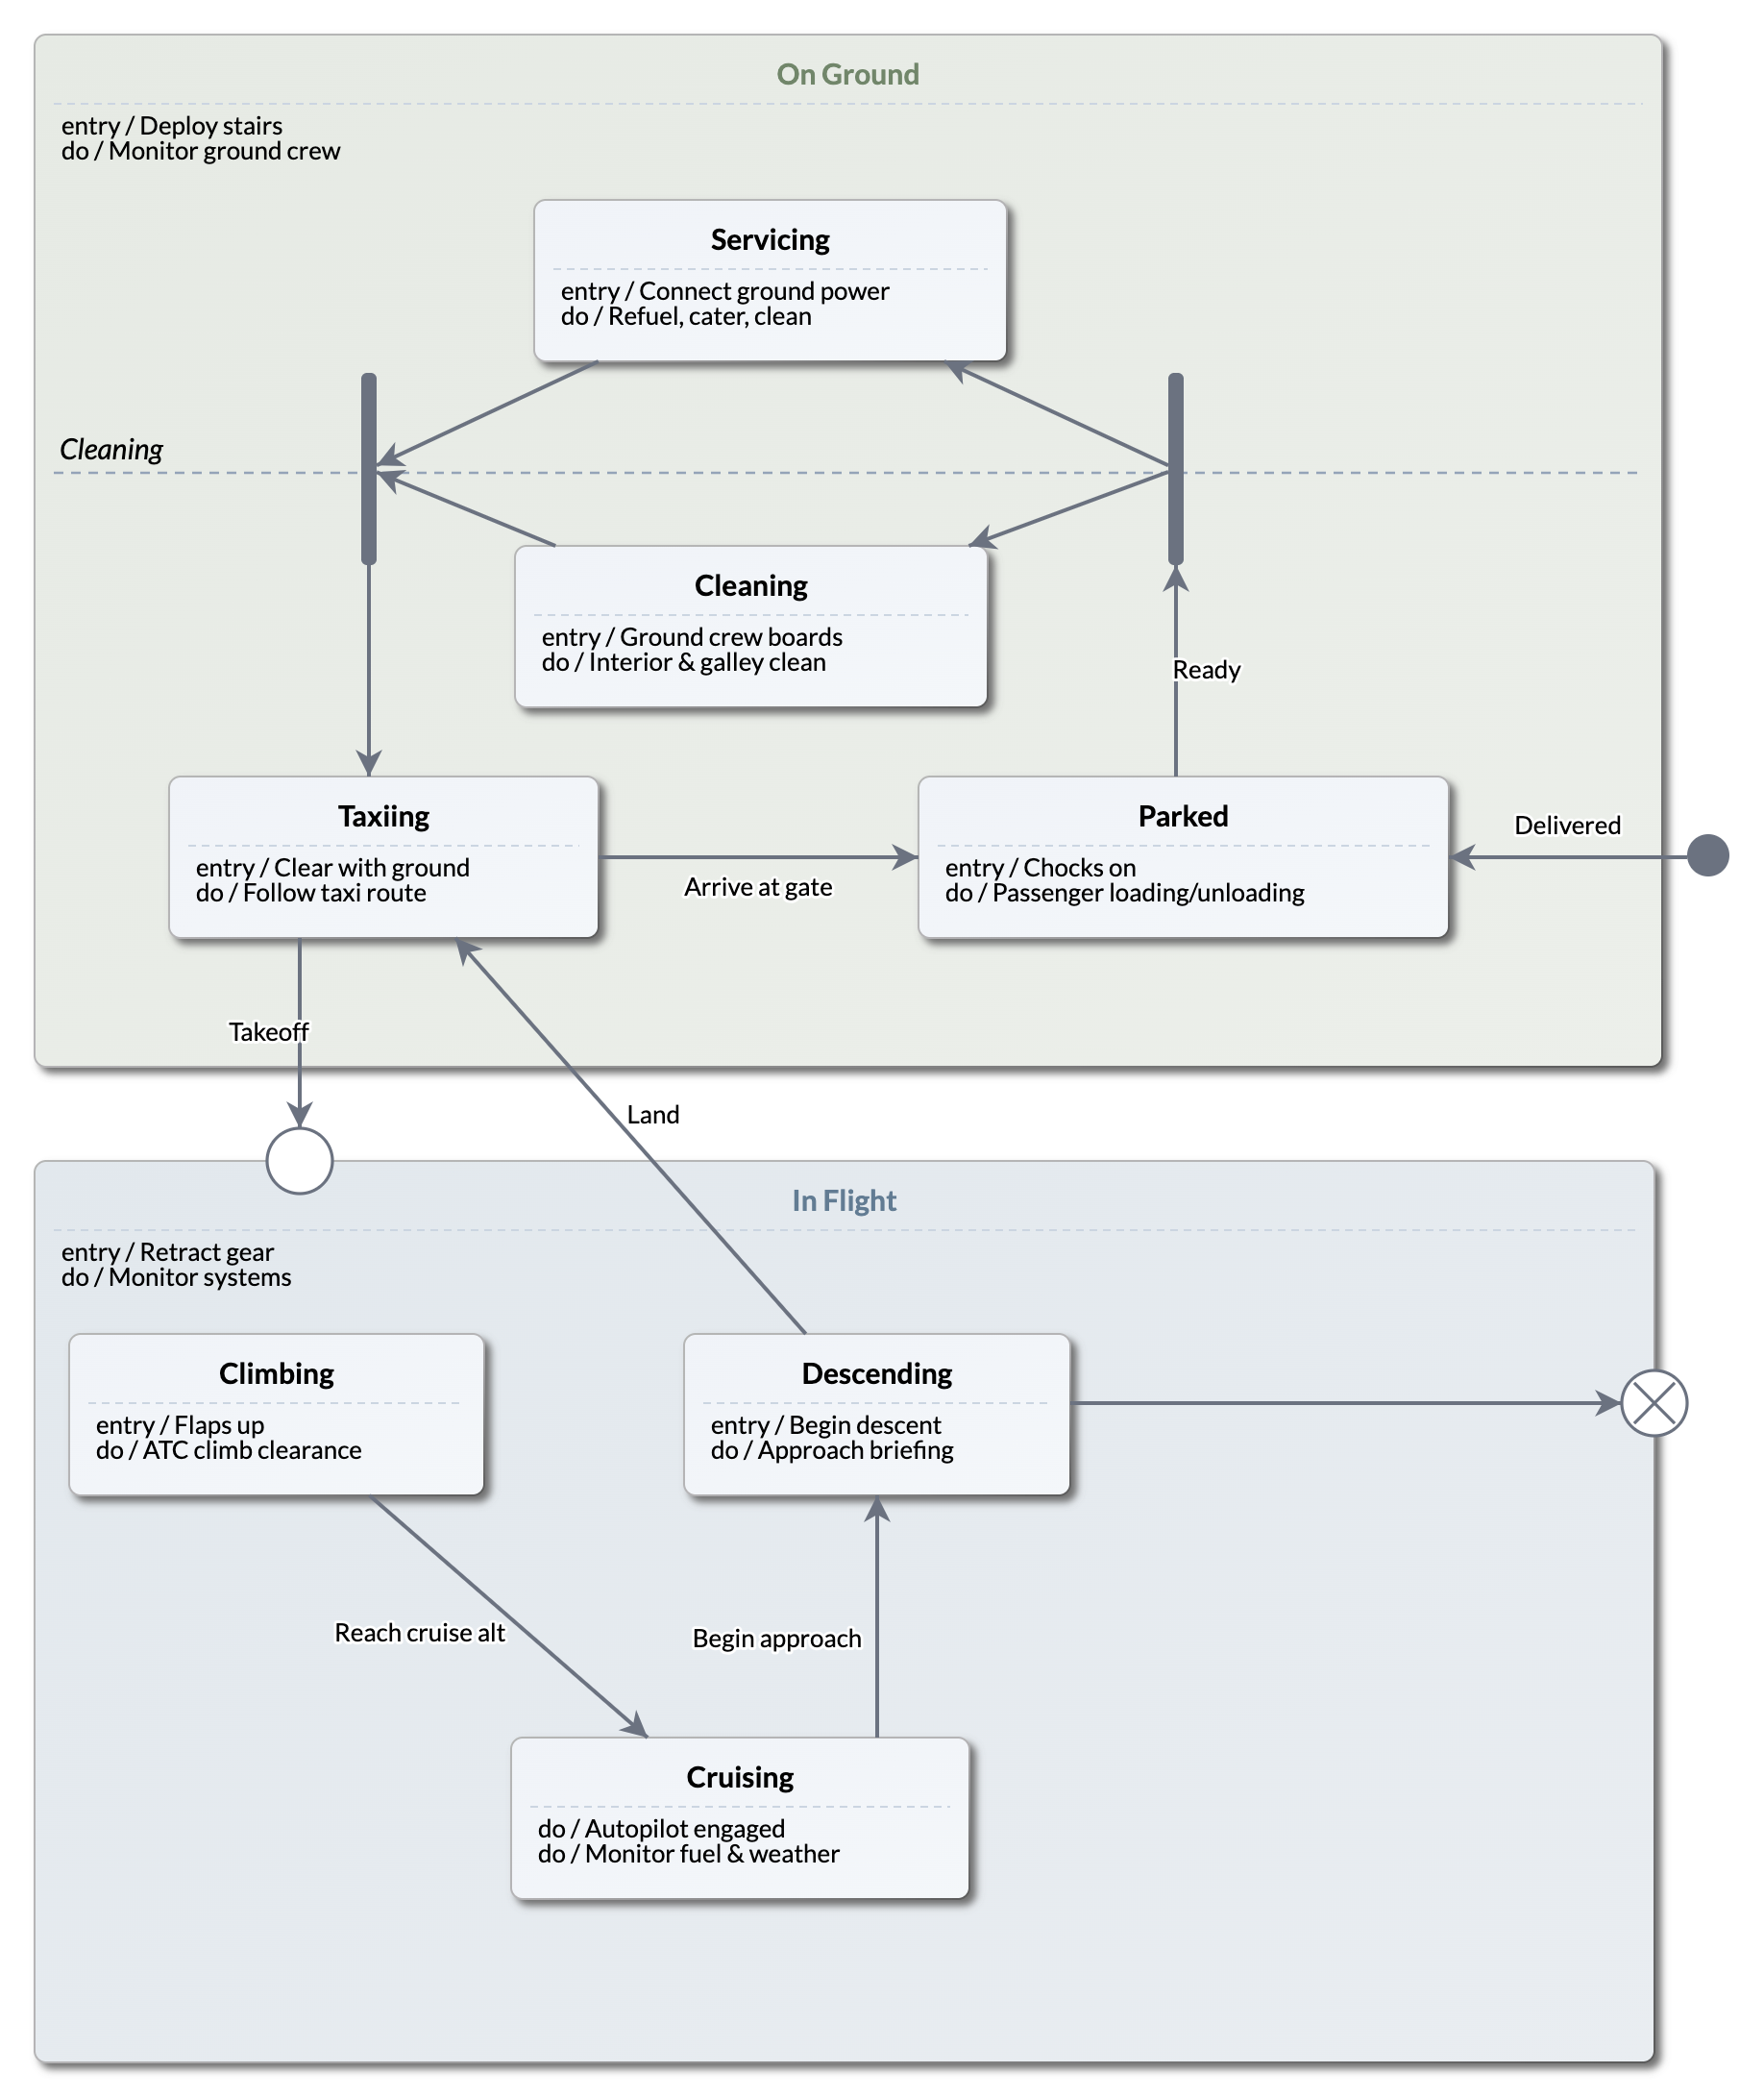
The lifecycle of one thing. An aircraft moves between composite states — On Ground (Parked, Servicing, Taxiing) and In Flight (Climbing, Cruising, Descending) — through labelled transitions. The diagram uses the full pseudostate kit: the initial dot, entry and exit points on composite borders, an orthogonal region for Cleaning, and a fork/join pair.
Activity diagram
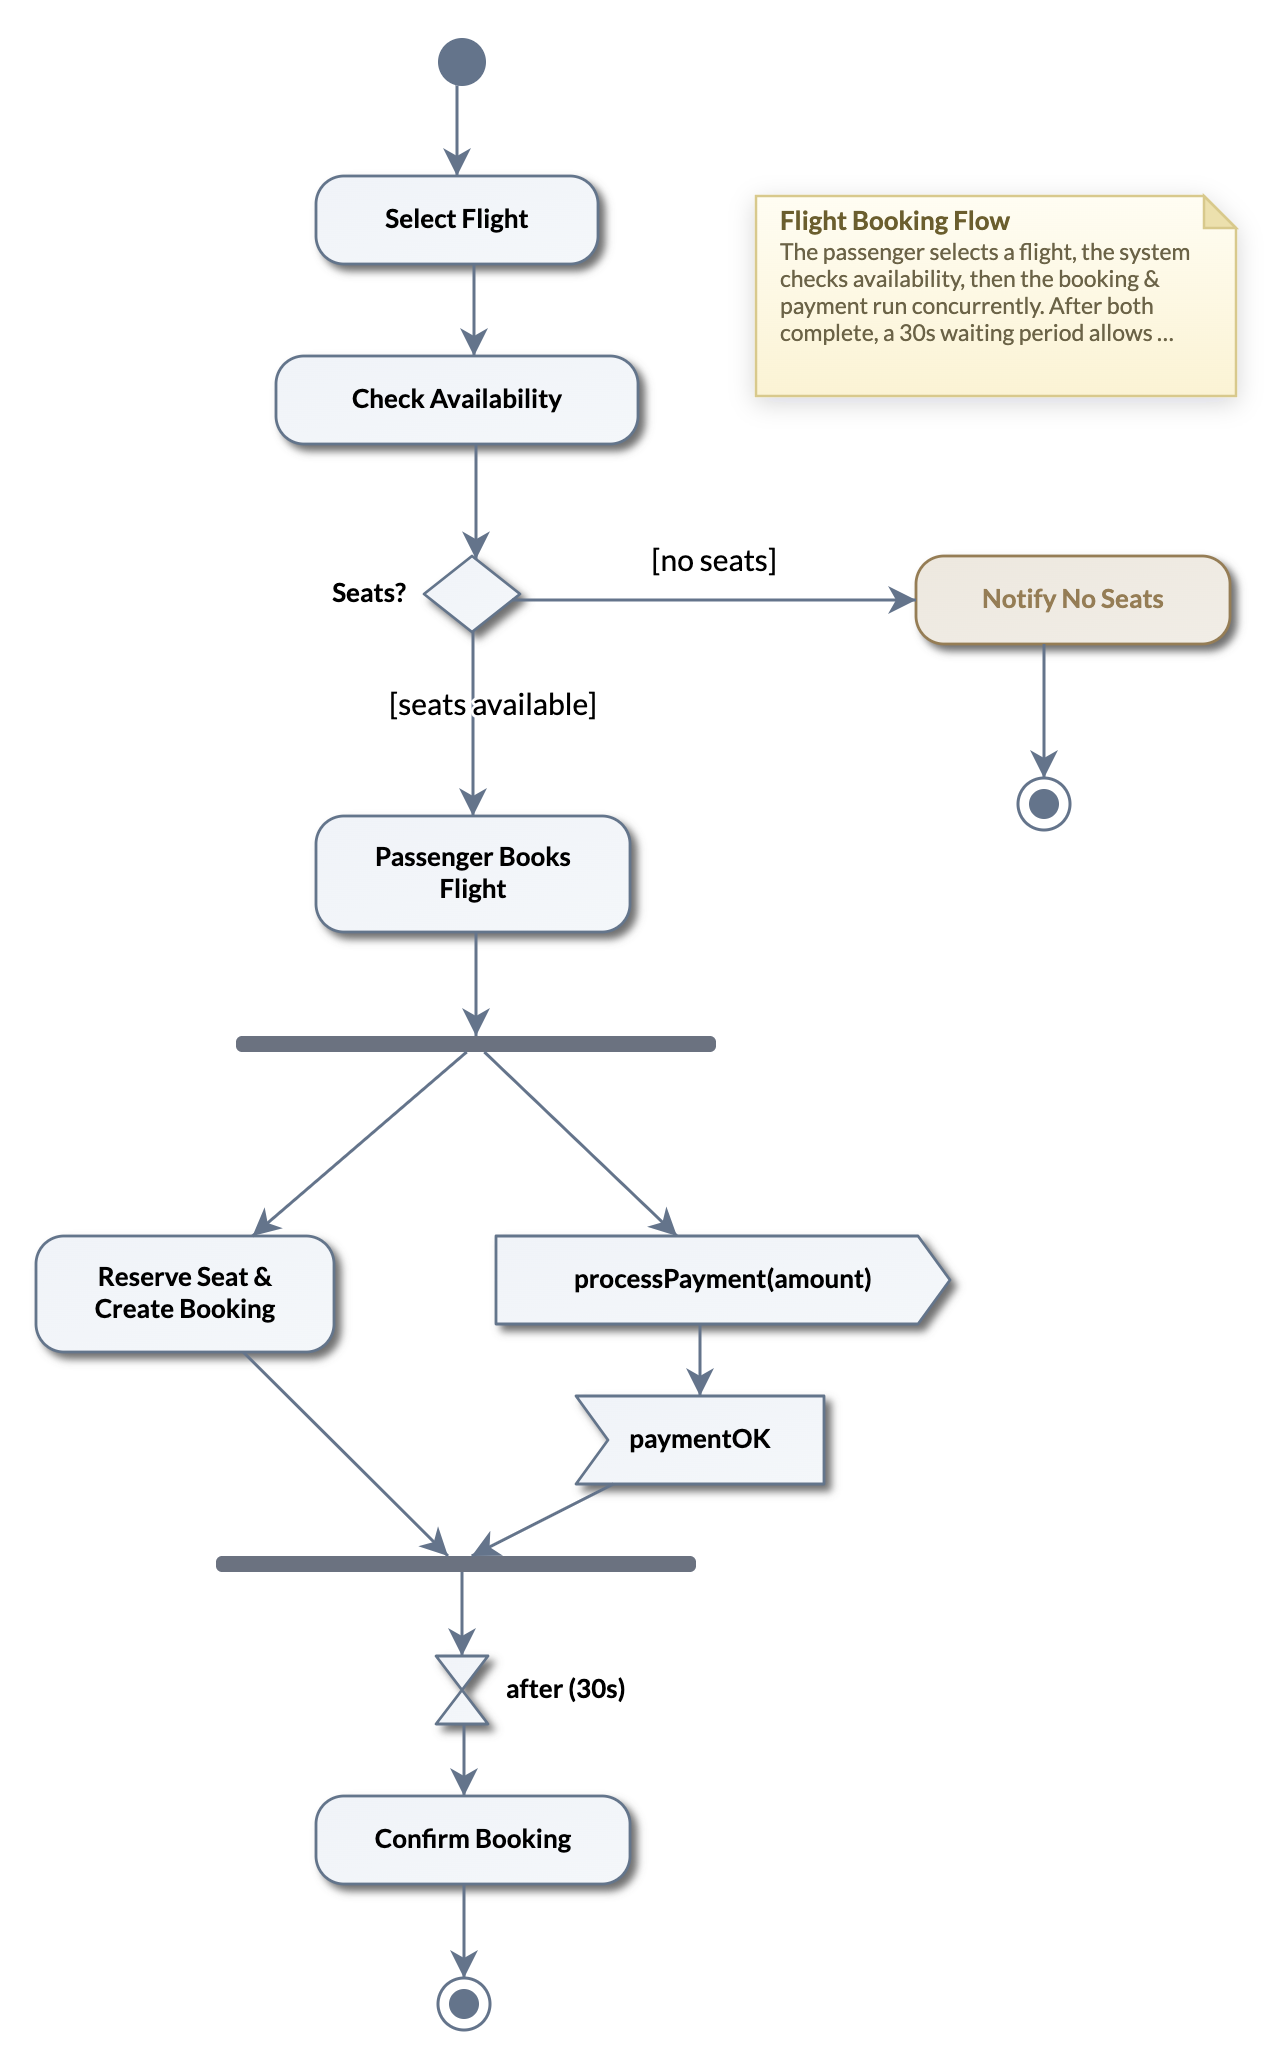
A flow of work with real concurrency. From the initial node, actions run through a decision (no seats ends the flow early), then a fork splits booking into parallel legs — reserve-and-create alongside send signal processPayment and accept event paymentOK — rejoined by a join before Confirm Booking. A time event (after 30 s) models the payment timeout path to a second final node.
6. C4 diagrams
The C4 model — created by Simon Brown (c4model.com) — describes a software system at four zoom levels: Context (the system among its users and neighbours), Containers (the deployable pieces), Components (the parts inside one container) and Code (the classes inside one component). Each level answers one audience's questions; together they replace the single overloaded “architecture diagram”. DrawMode gives the four views their own shapes — people, systems, containers, components and databases, joined by labelled relationships.
Level 1 — System Context
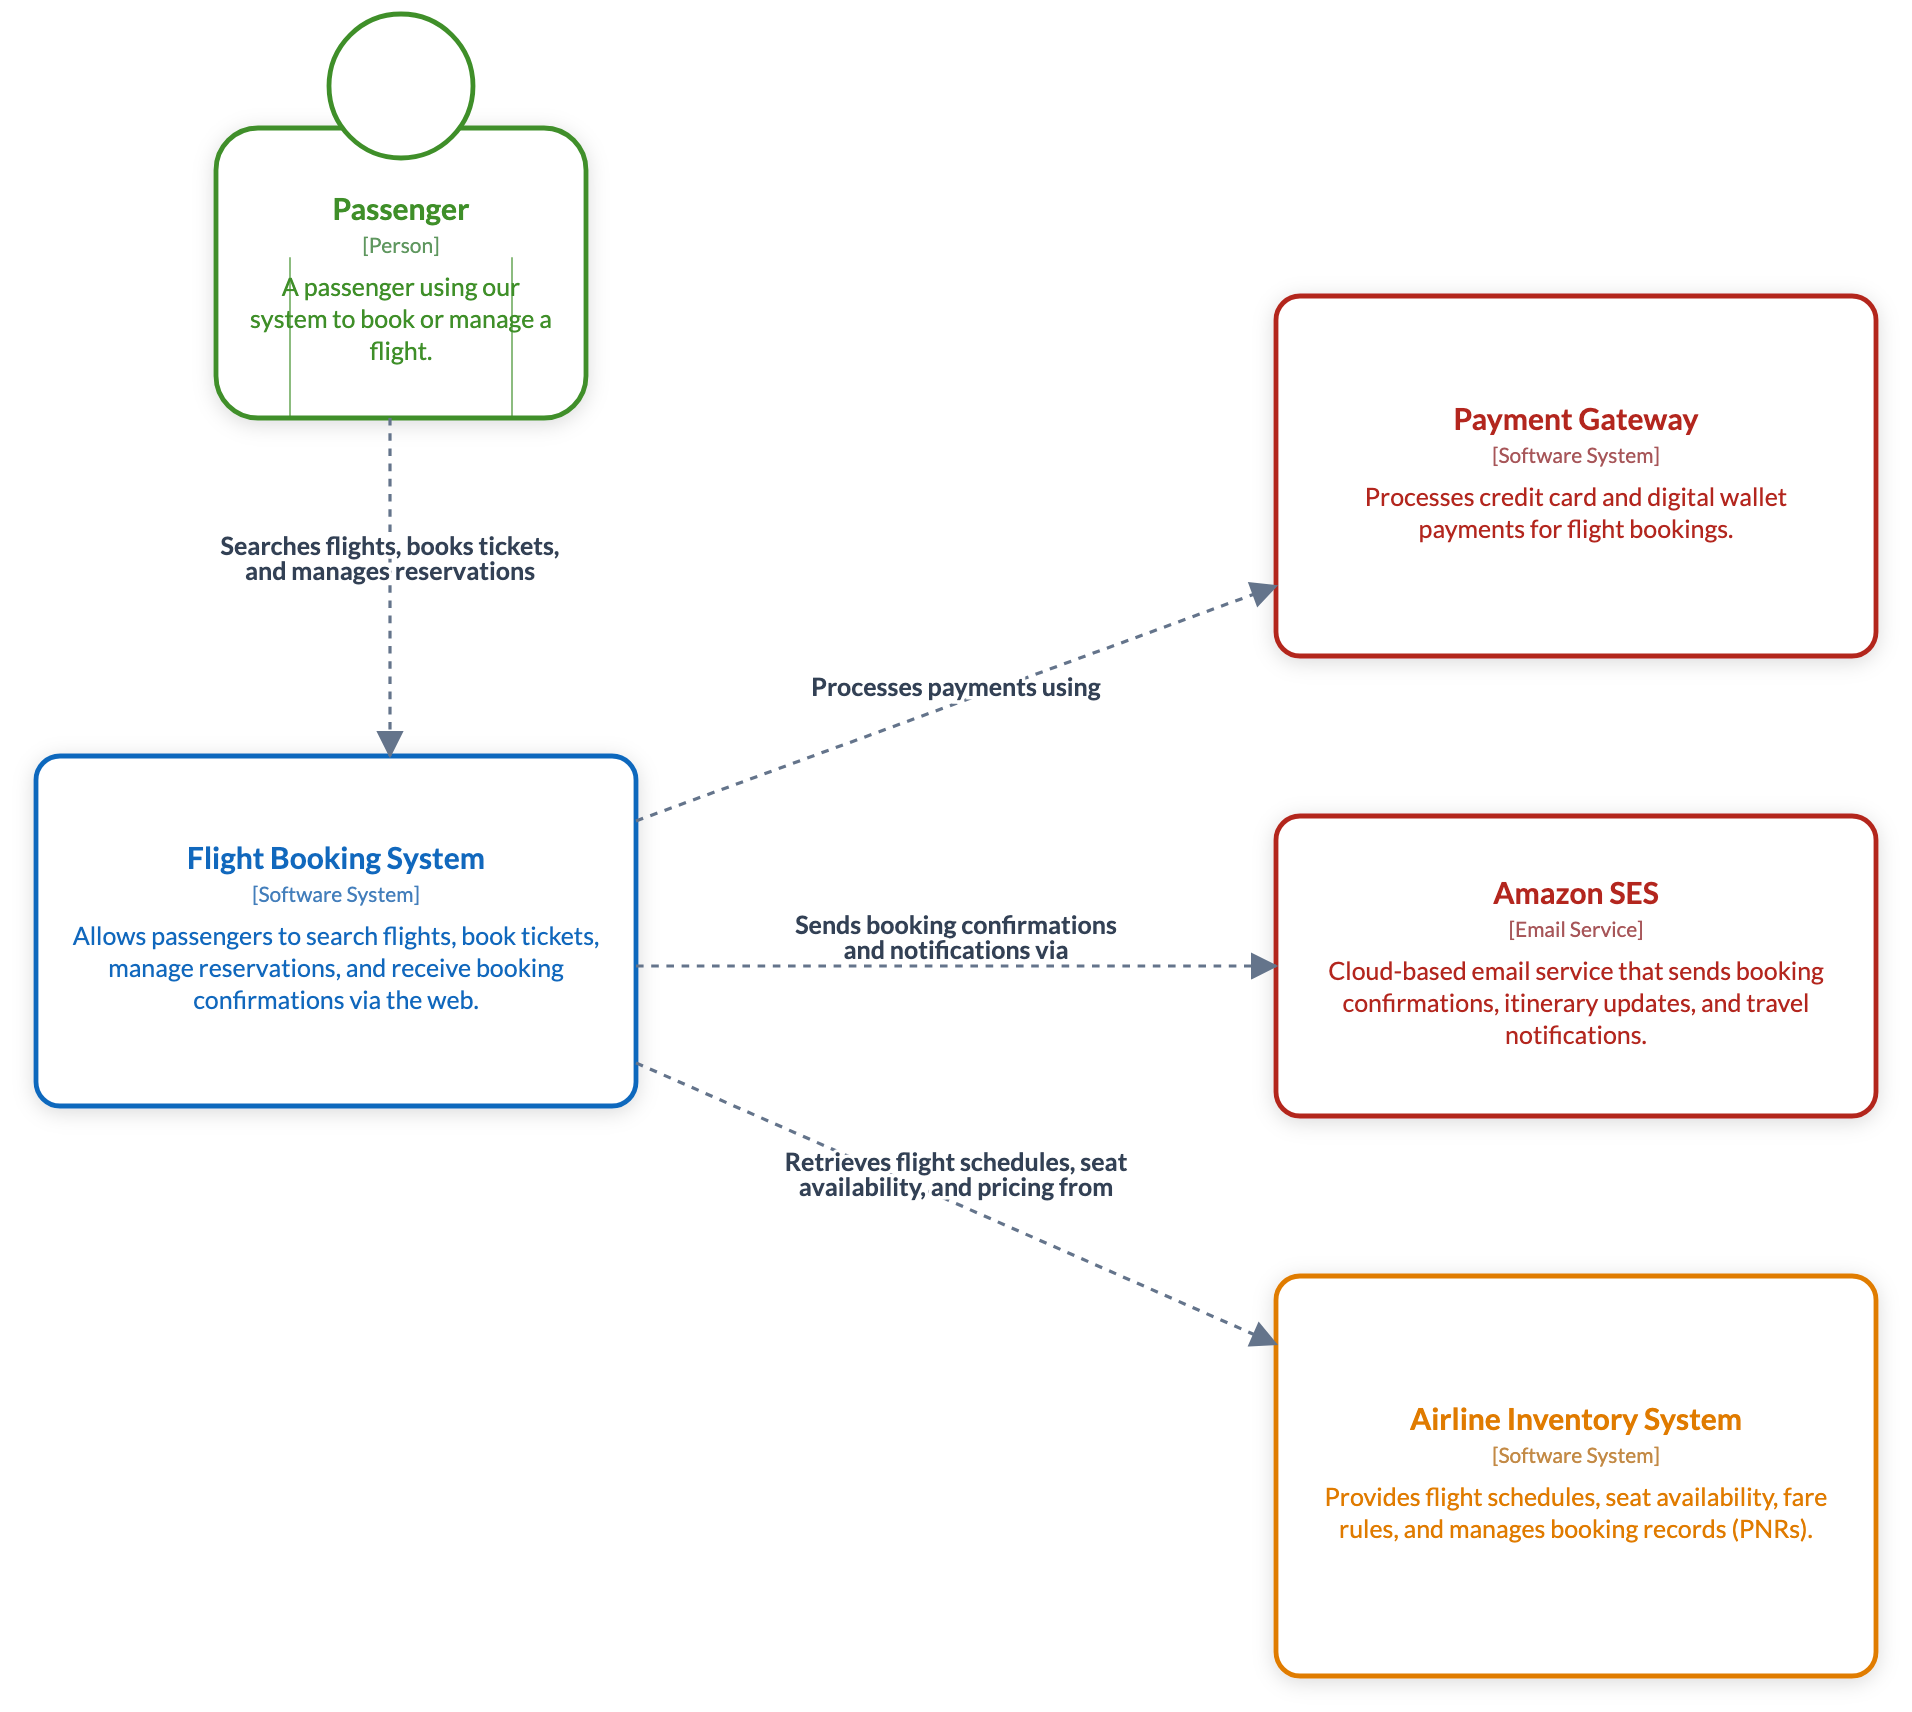
The Flight Booking System in the middle; the Passenger and the three external systems it depends on — payment, e-mail and airline inventory — around it. Every relationship reads as a sentence.
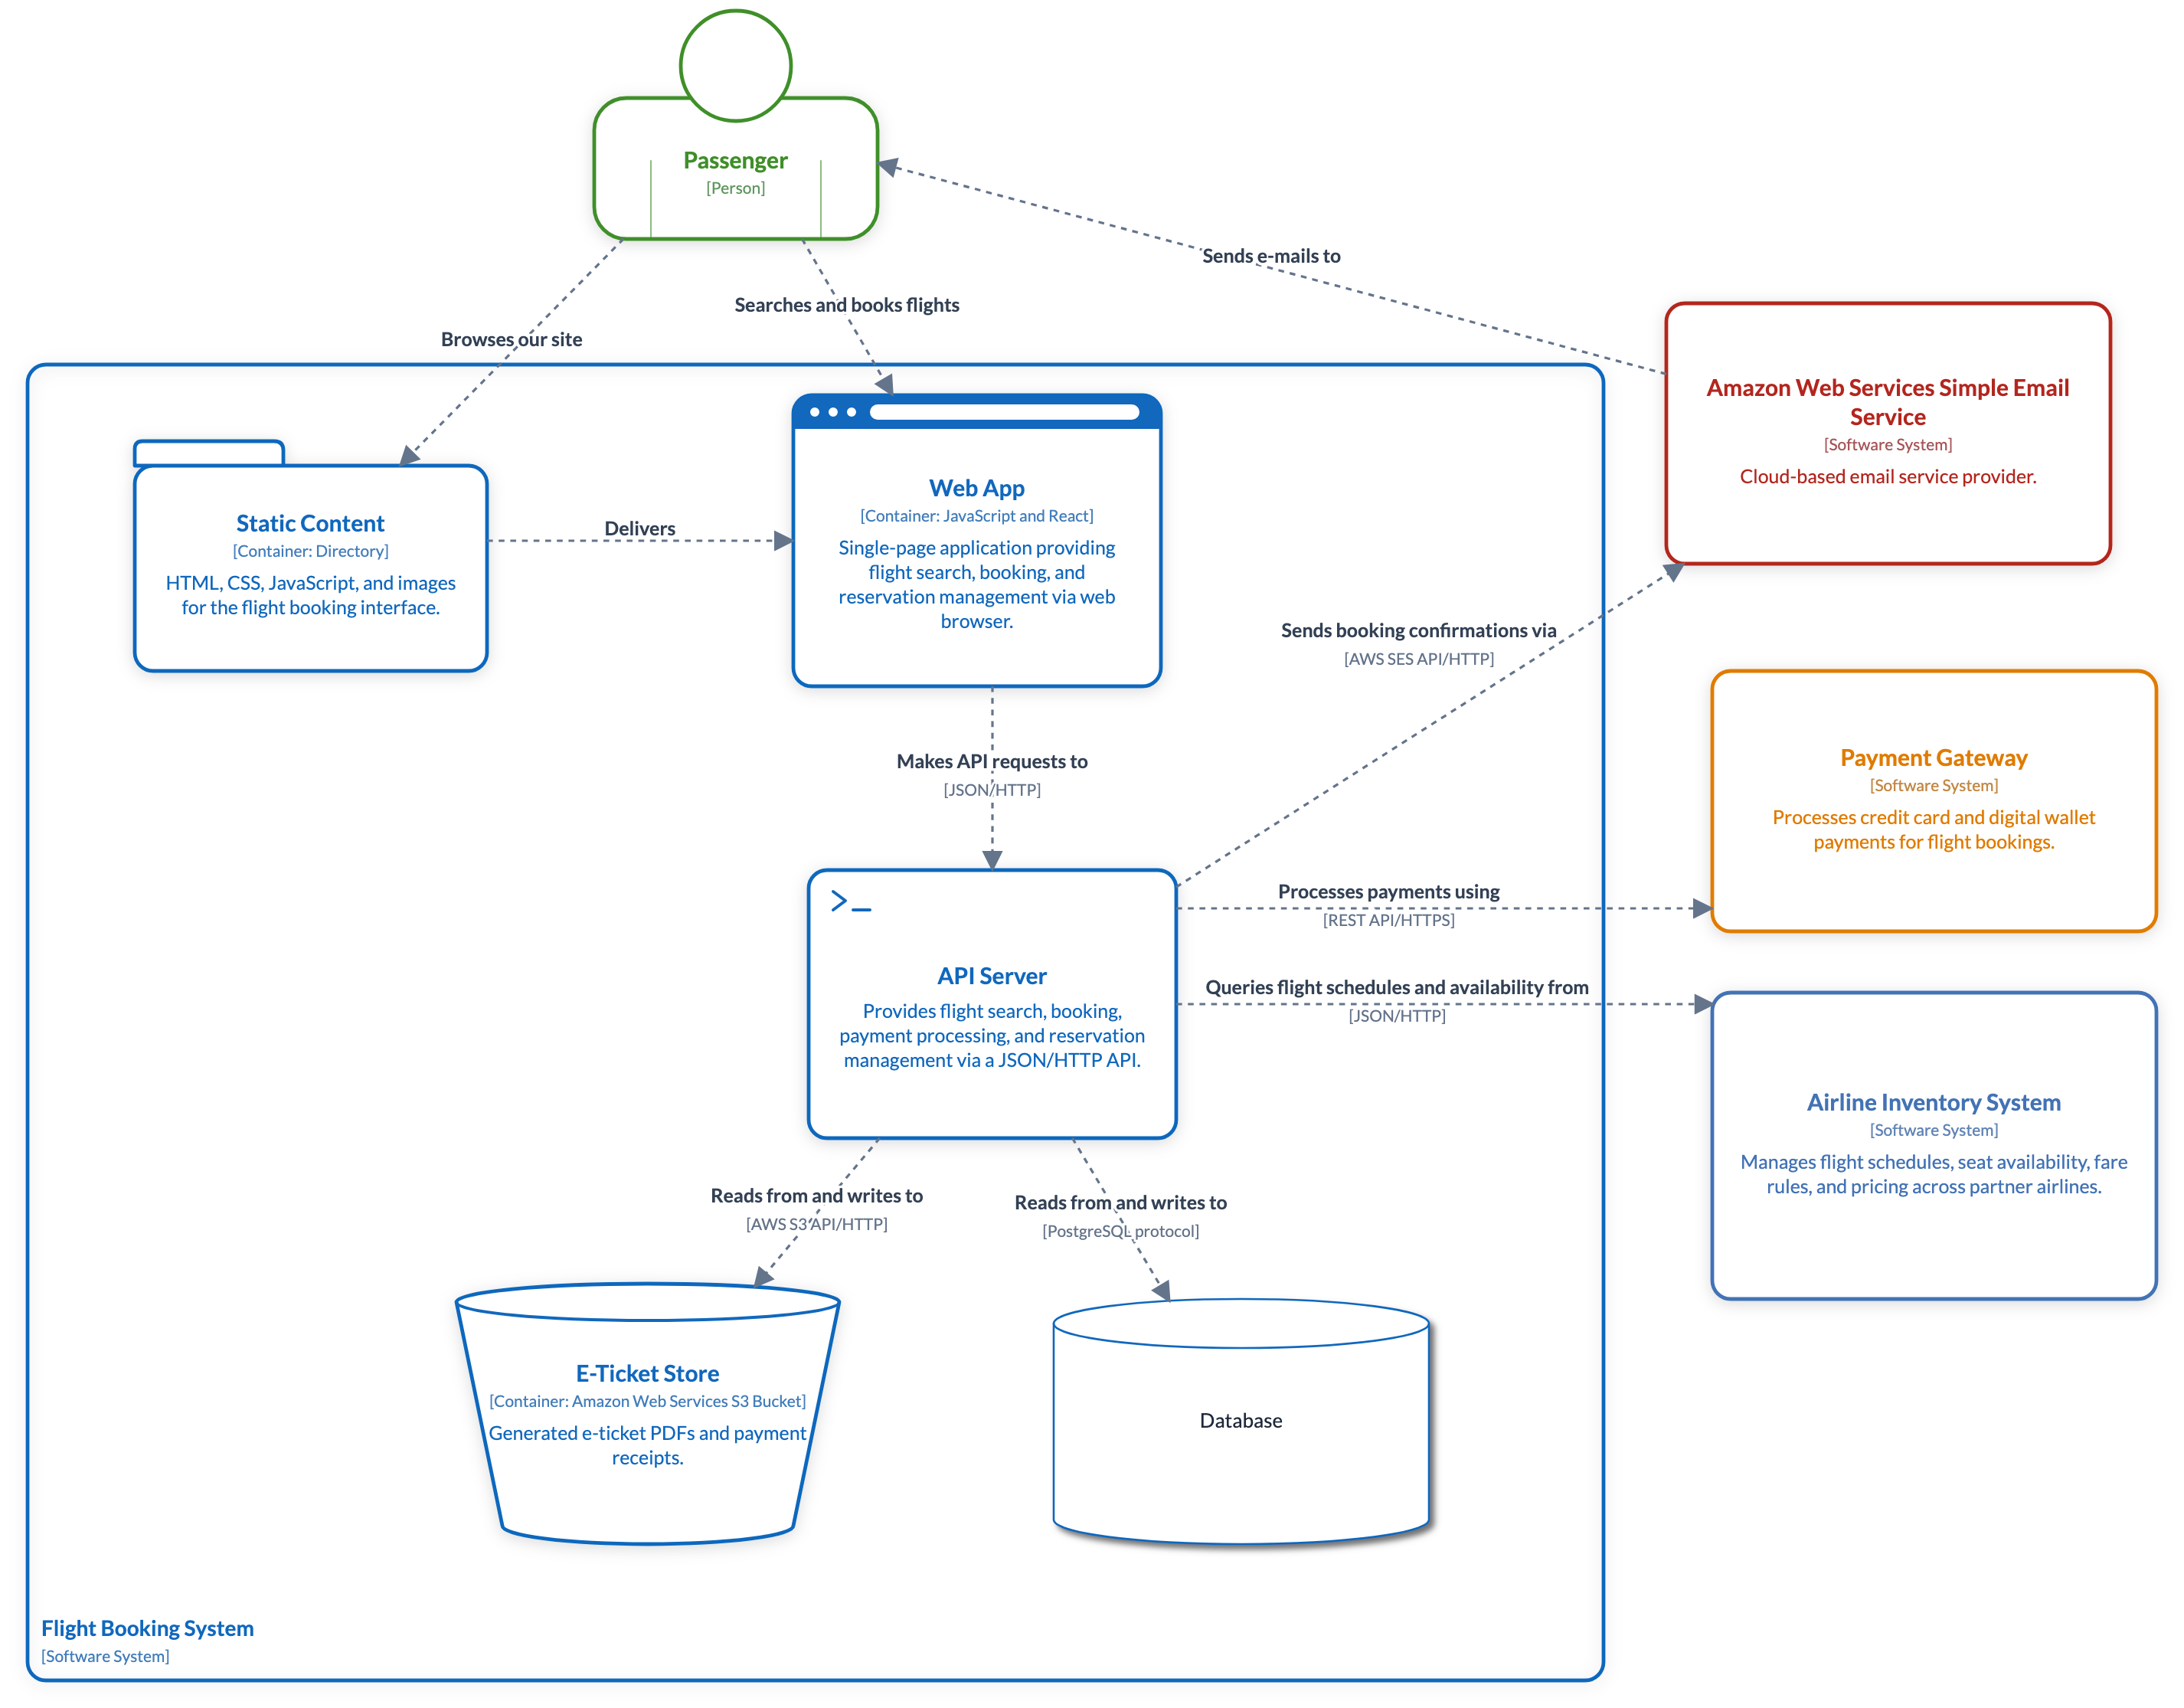
Level 2 — Container
Zooming into the system boundary: the web app and API server, the database, static content and the e-ticket store, with the external systems still on the rim. Arrows carry the how — API requests, reads/writes, delivery.
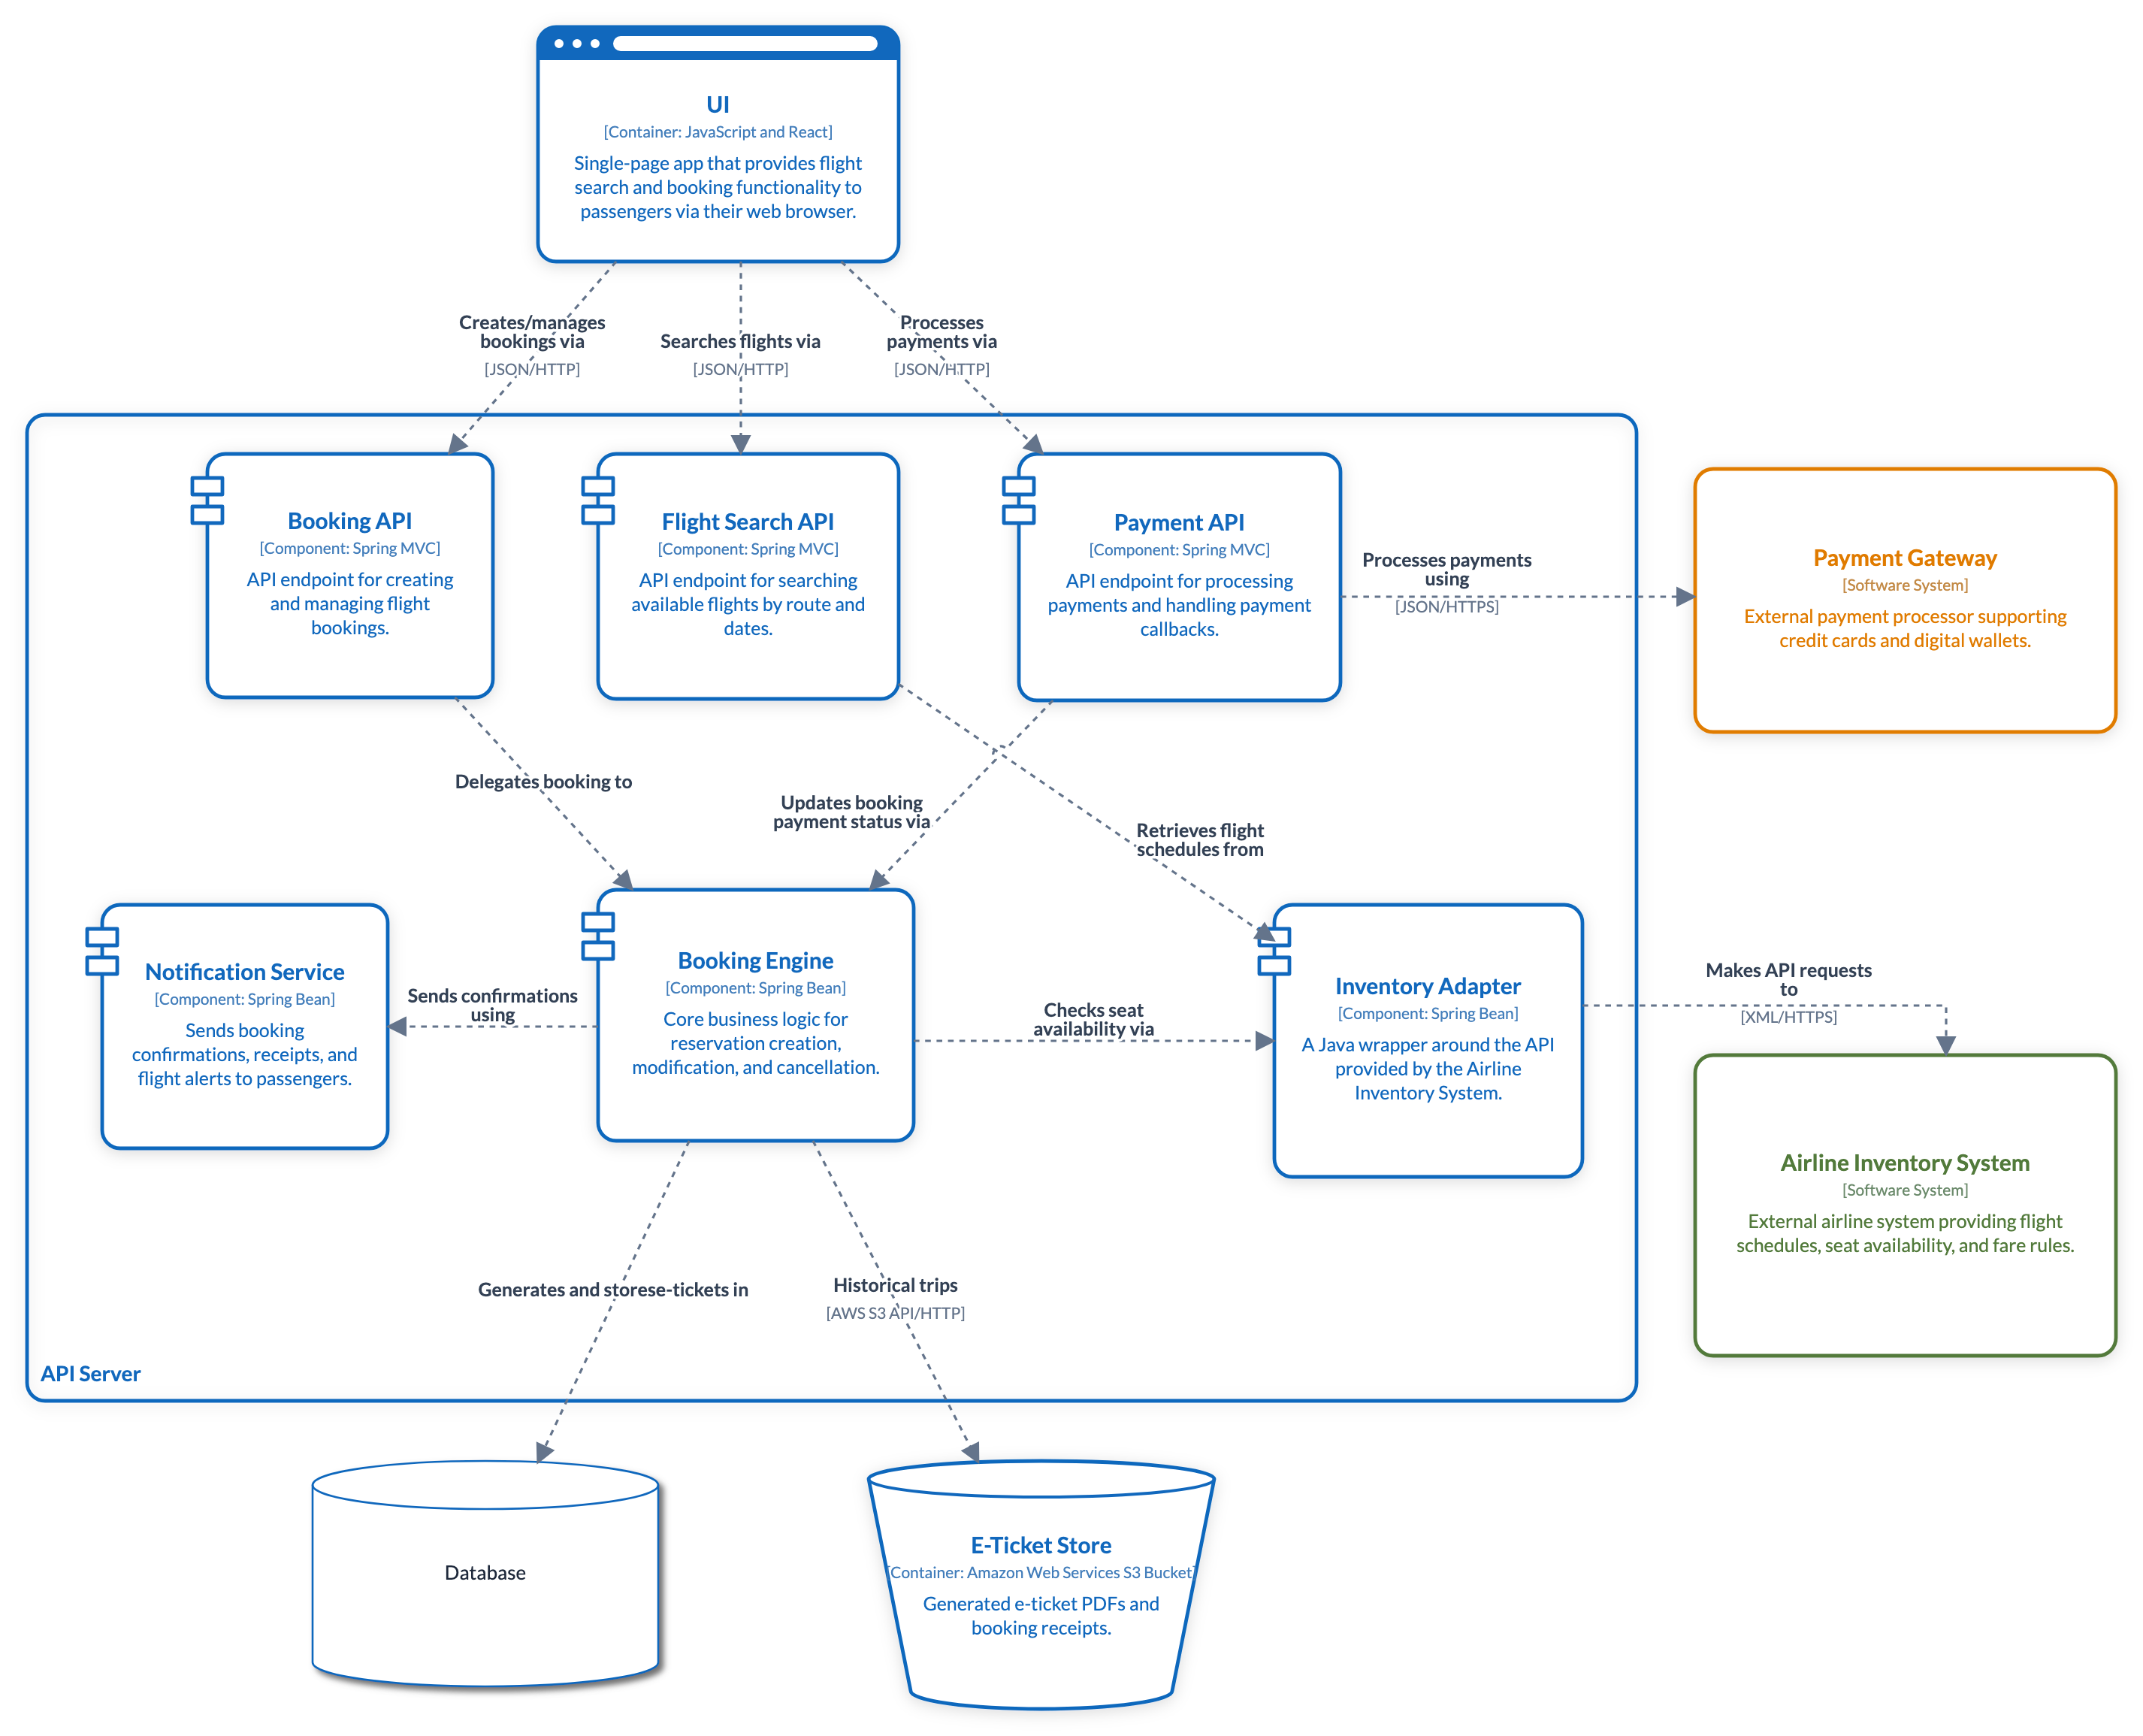
Level 3 — Component
Inside the API server: search, booking, payment and notification APIs over a booking engine and an inventory adapter, wired to the database, the e-ticket bucket and the external systems.
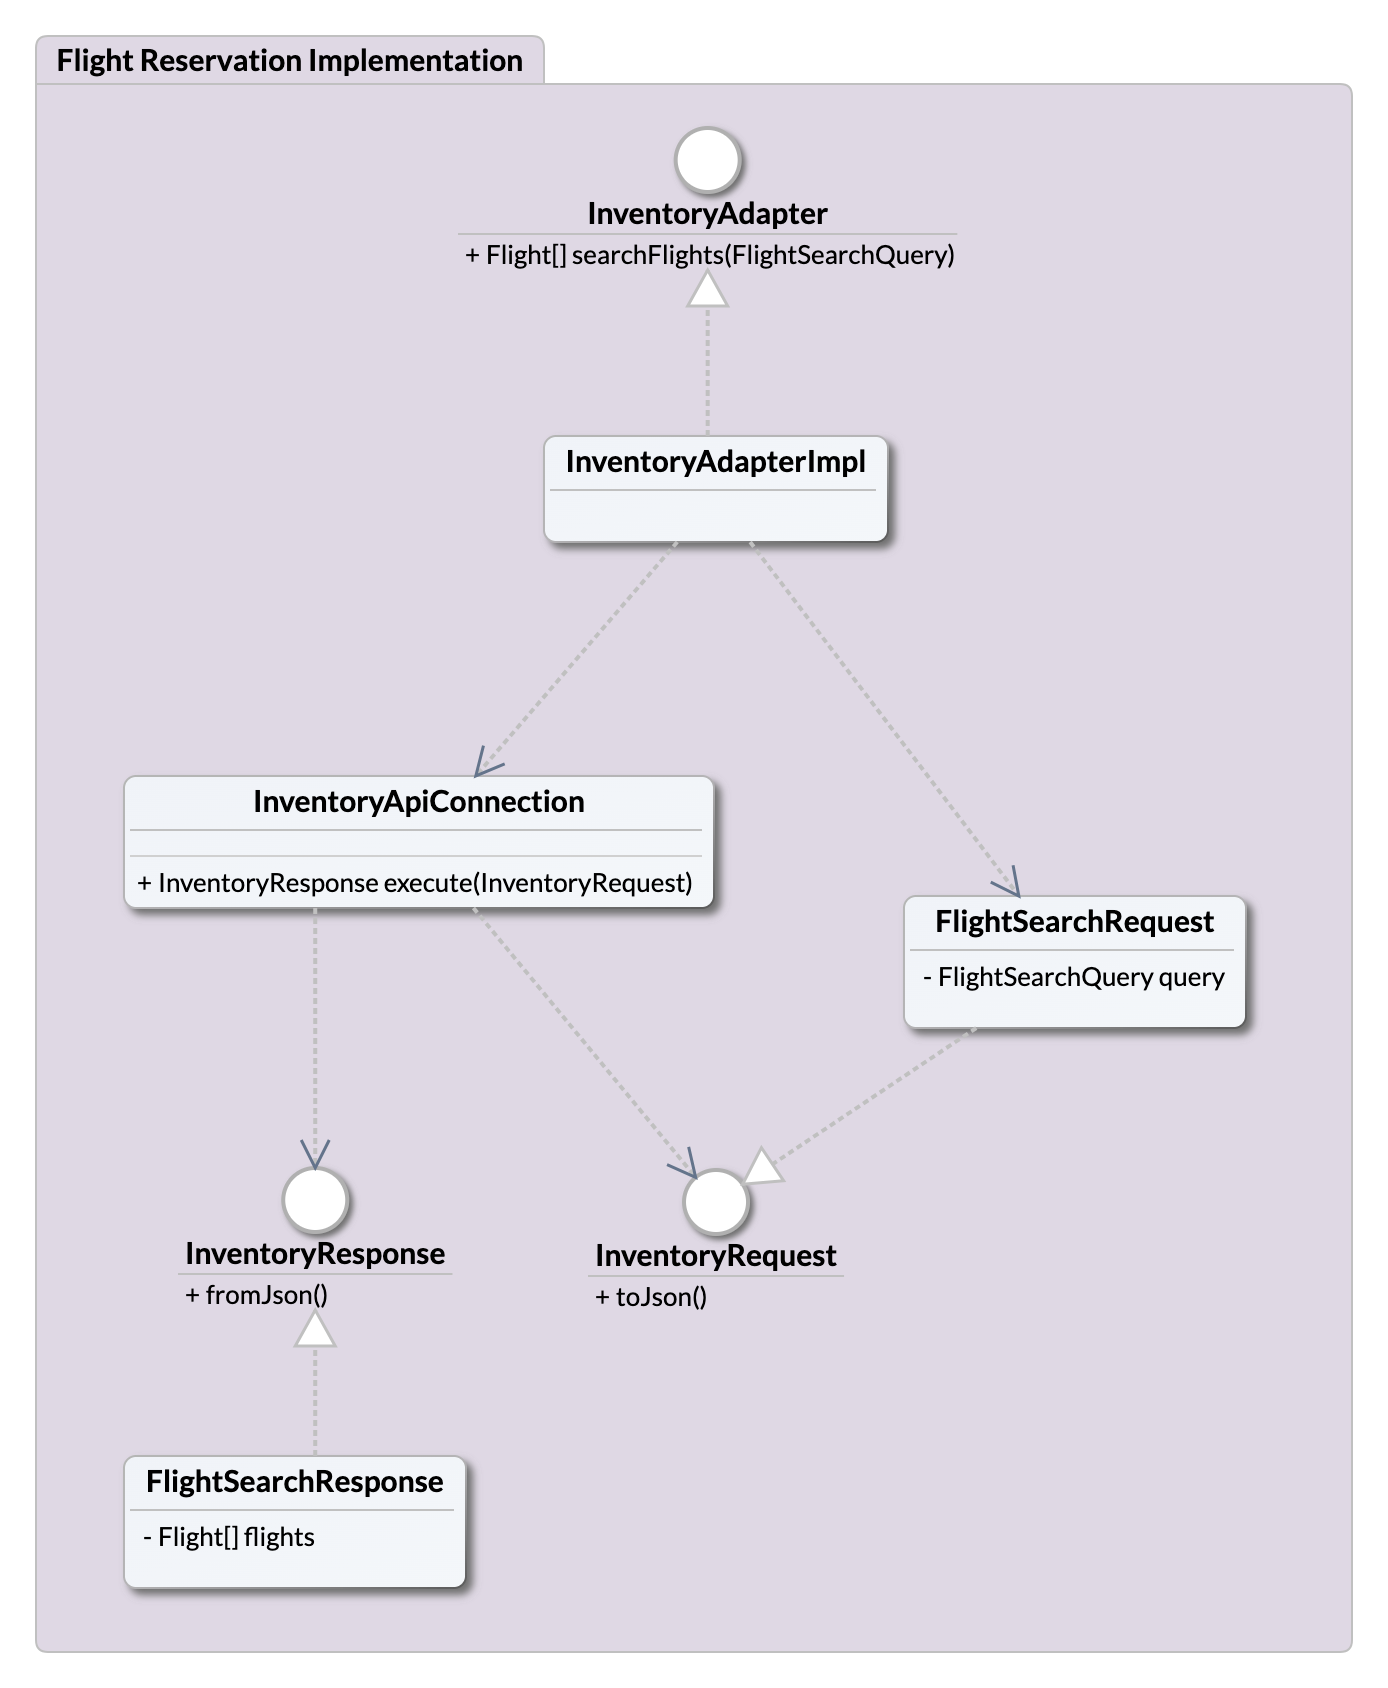
Level 4 — Code
The final zoom is plain UML: the inventory adapter's interface, implementation and request/response types as a small class diagram inside a package.
7. Software diagrams
Database schemas
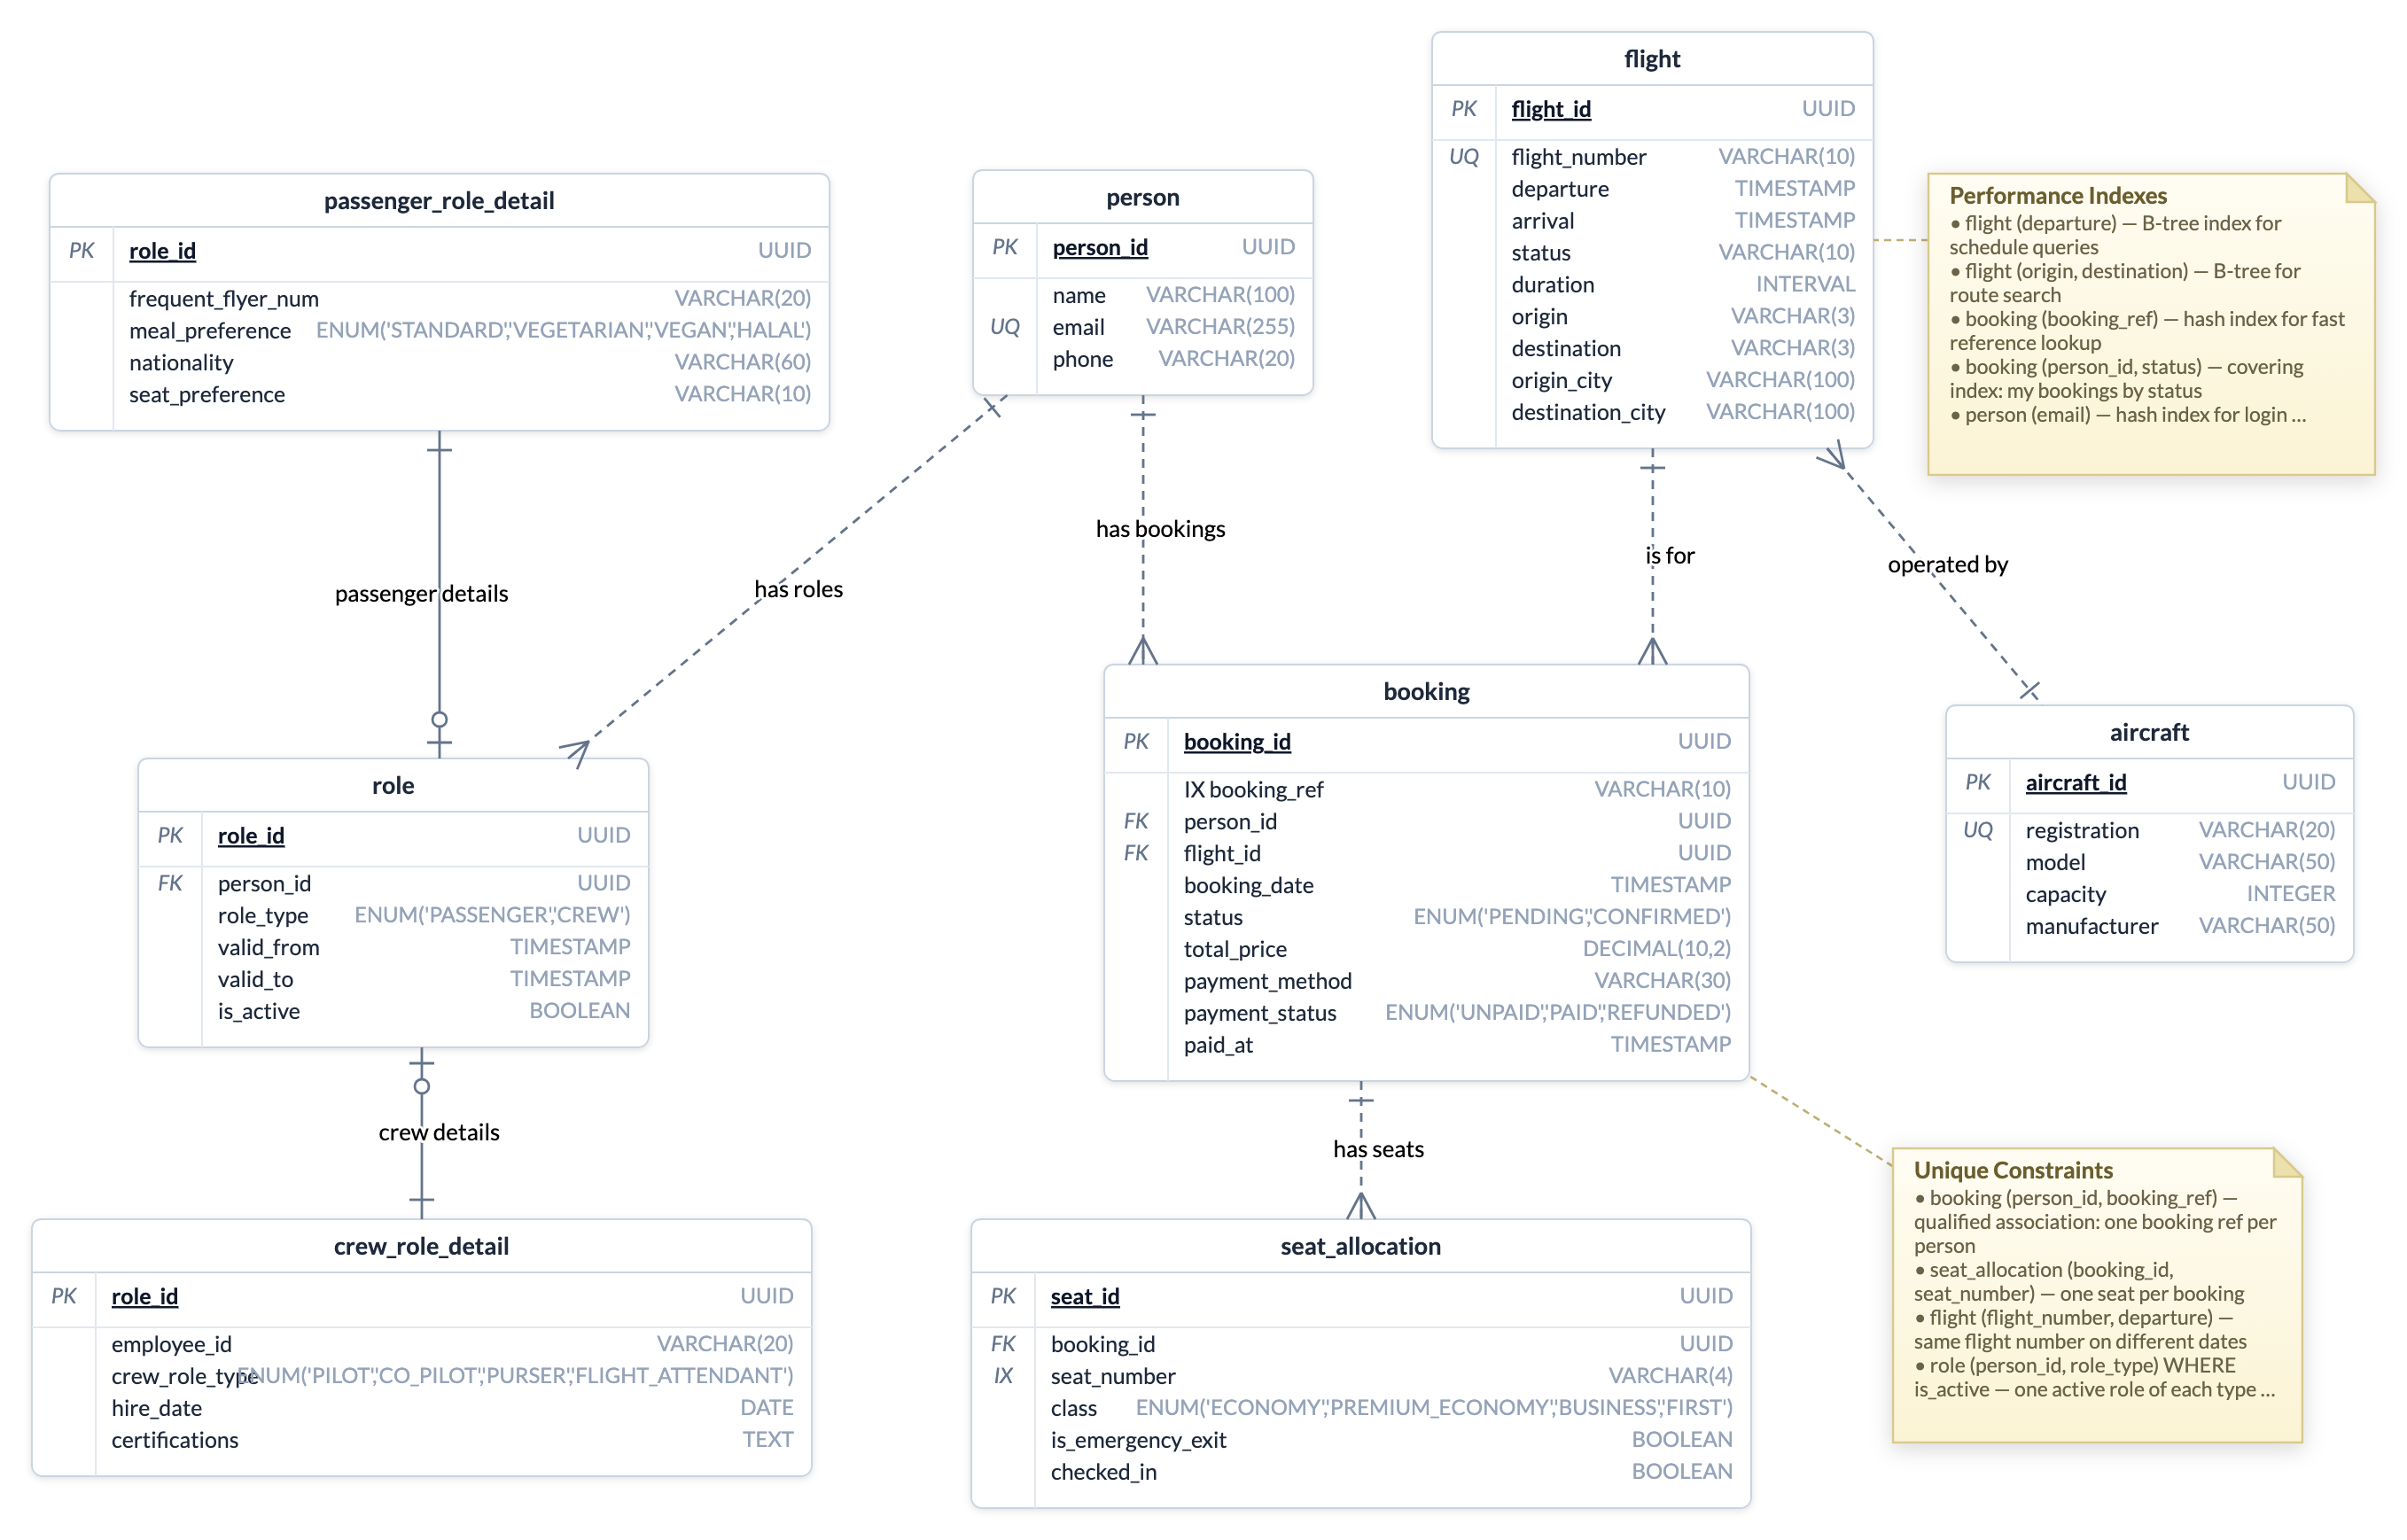
A table is a name header plus columns; each column carries an optional key marker, a name and a type. PK columns render bold and underlined above the separator; FK marks foreign keys; UQ flags unique columns and IX secondary-indexed ones — so booking.booking_ref reads as an indexed lookup code and person.email as a unique login key at a glance. Types are free text, so ENUM('PENDING','CONFIRMED') or DECIMAL(10,2) document themselves. Notes carry the rest of the physical design — here, the B-tree/hash/covering performance indexes and the unique constraints.
Relationships are crow's-foot: each end takes a cardinality — one, many, zero-one, one-many, zero-many, or none — and the line itself is solid for identifying relationships (the child's key contains the parent's) and dashed for non-identifying.
Flowcharts
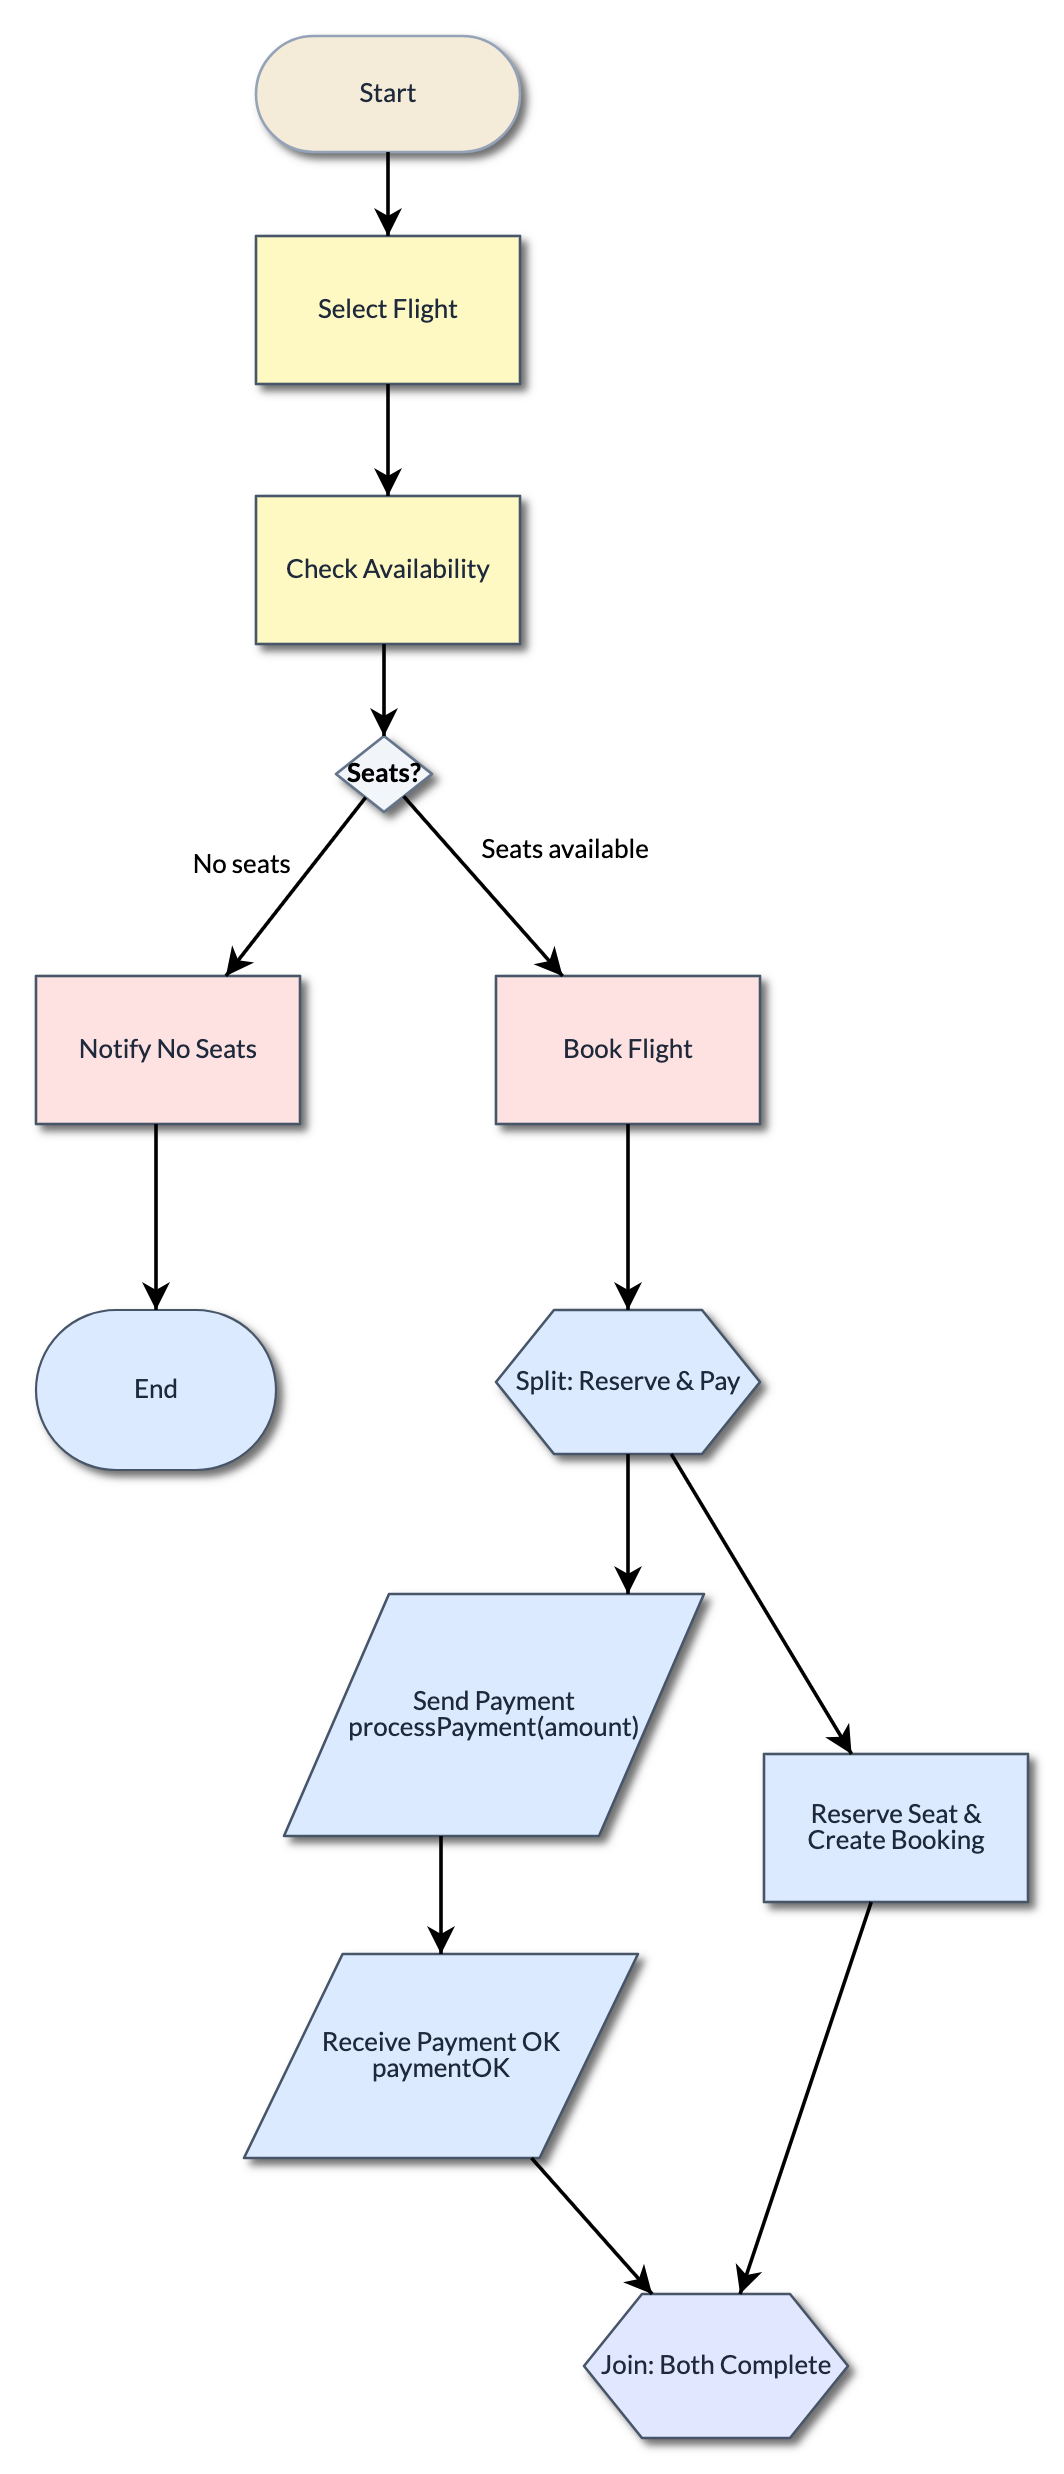
Classic flowchart notation for anything procedural: terminators for start and end, process boxes, a decision diamond with labelled exits (Seats available / No seats), preparation hexagons marking the split and join of the parallel leg, and slanted input/output boxes for the payment messages.
Feature diagrams
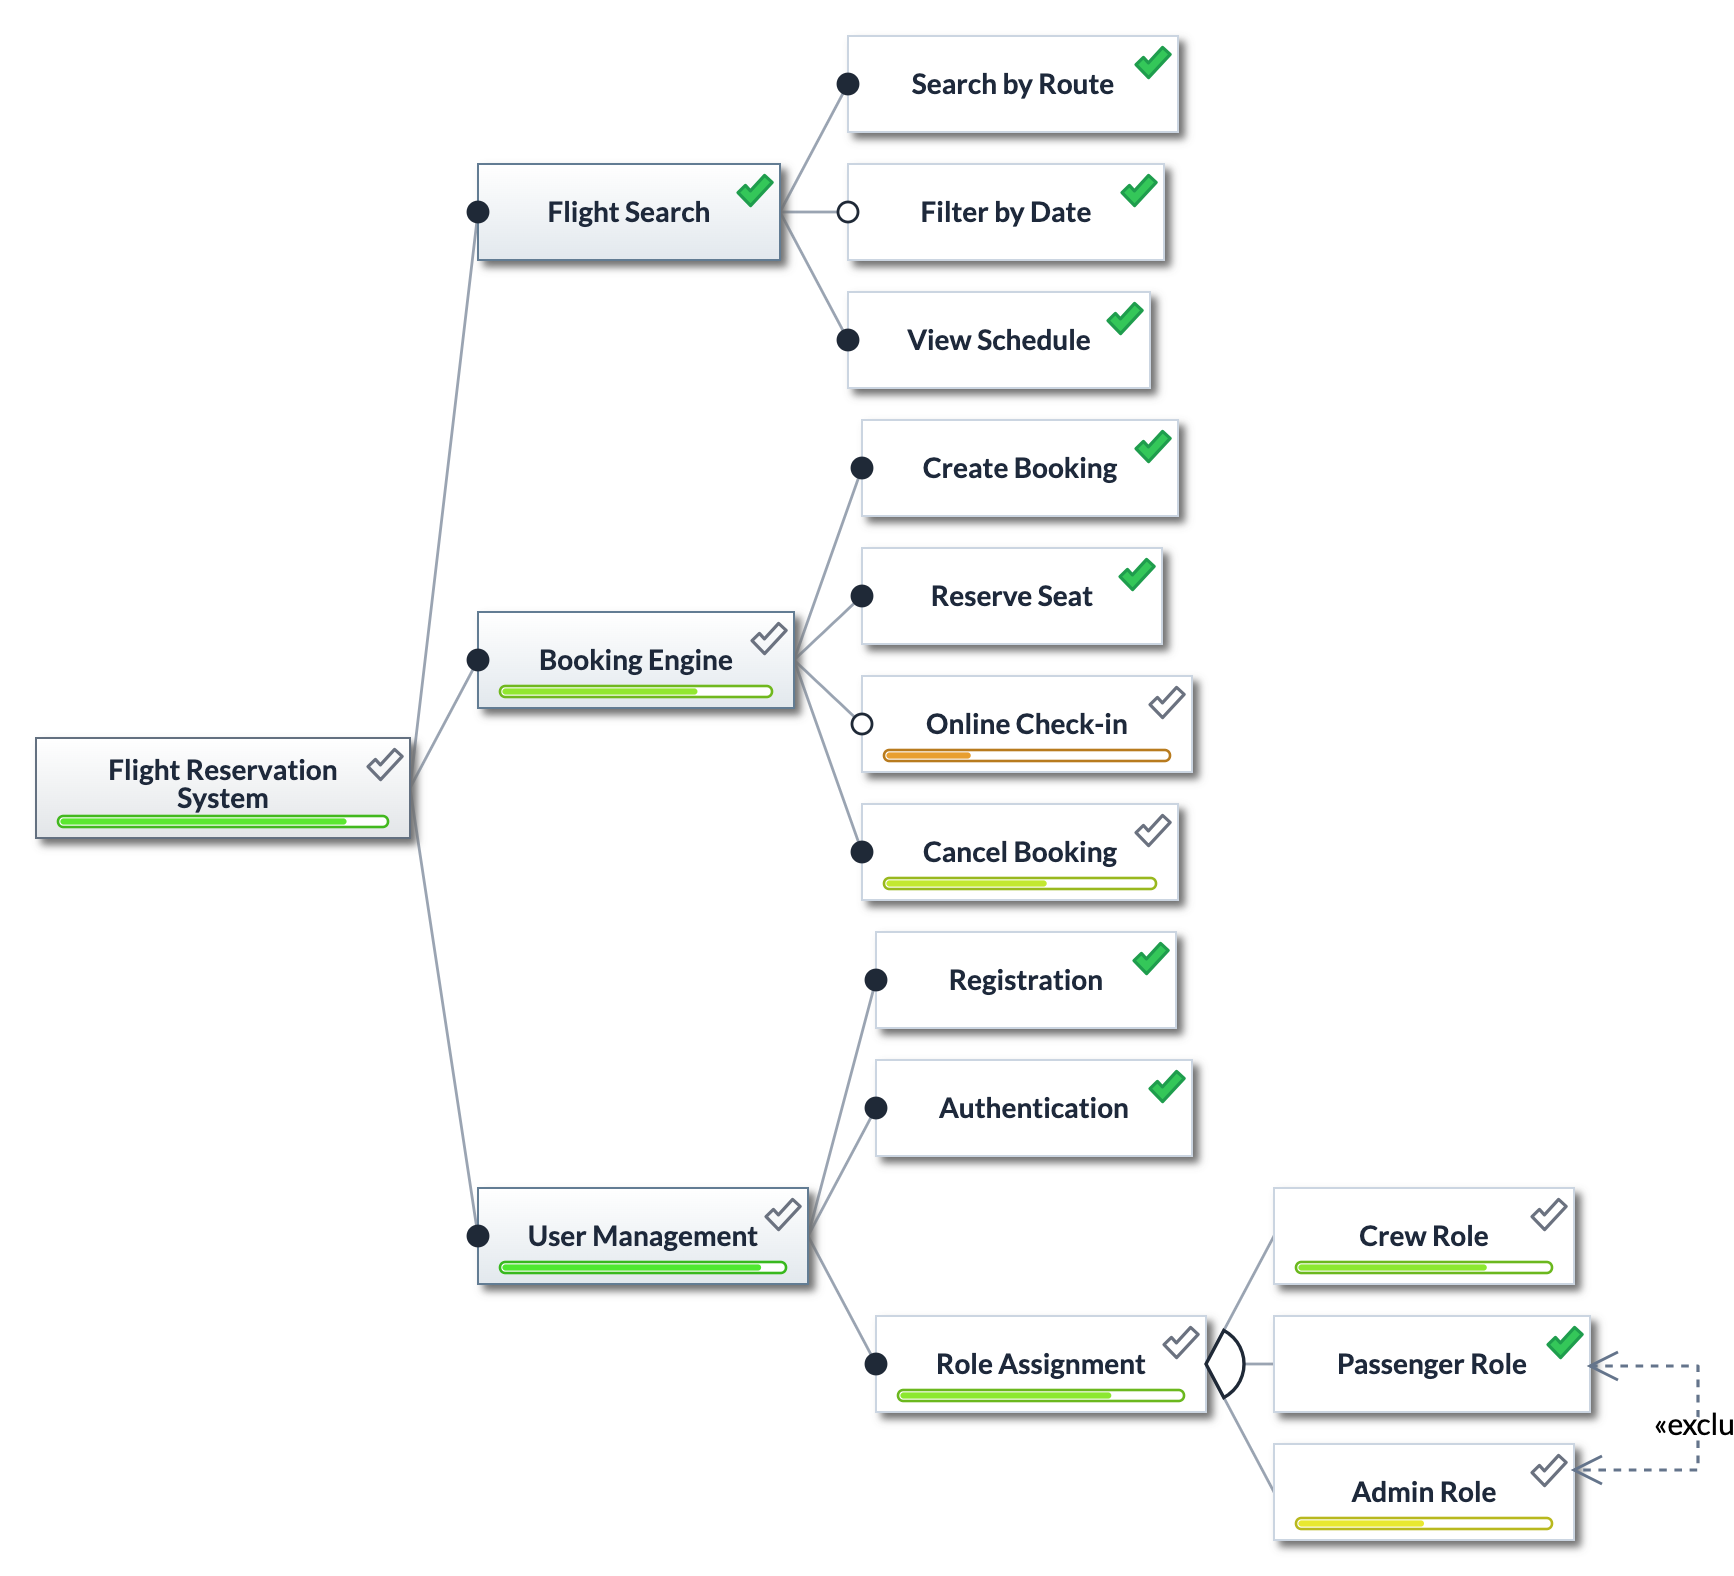
A feature model breaks a product into a hierarchy of features — here two levels from the root system down through user management, search and the booking engine. Nodes carry progress badges (percent-complete rings; a tick when done) so the model doubles as a delivery map, and constraint links such as excludes record that two features cannot ship together.
UI mockups
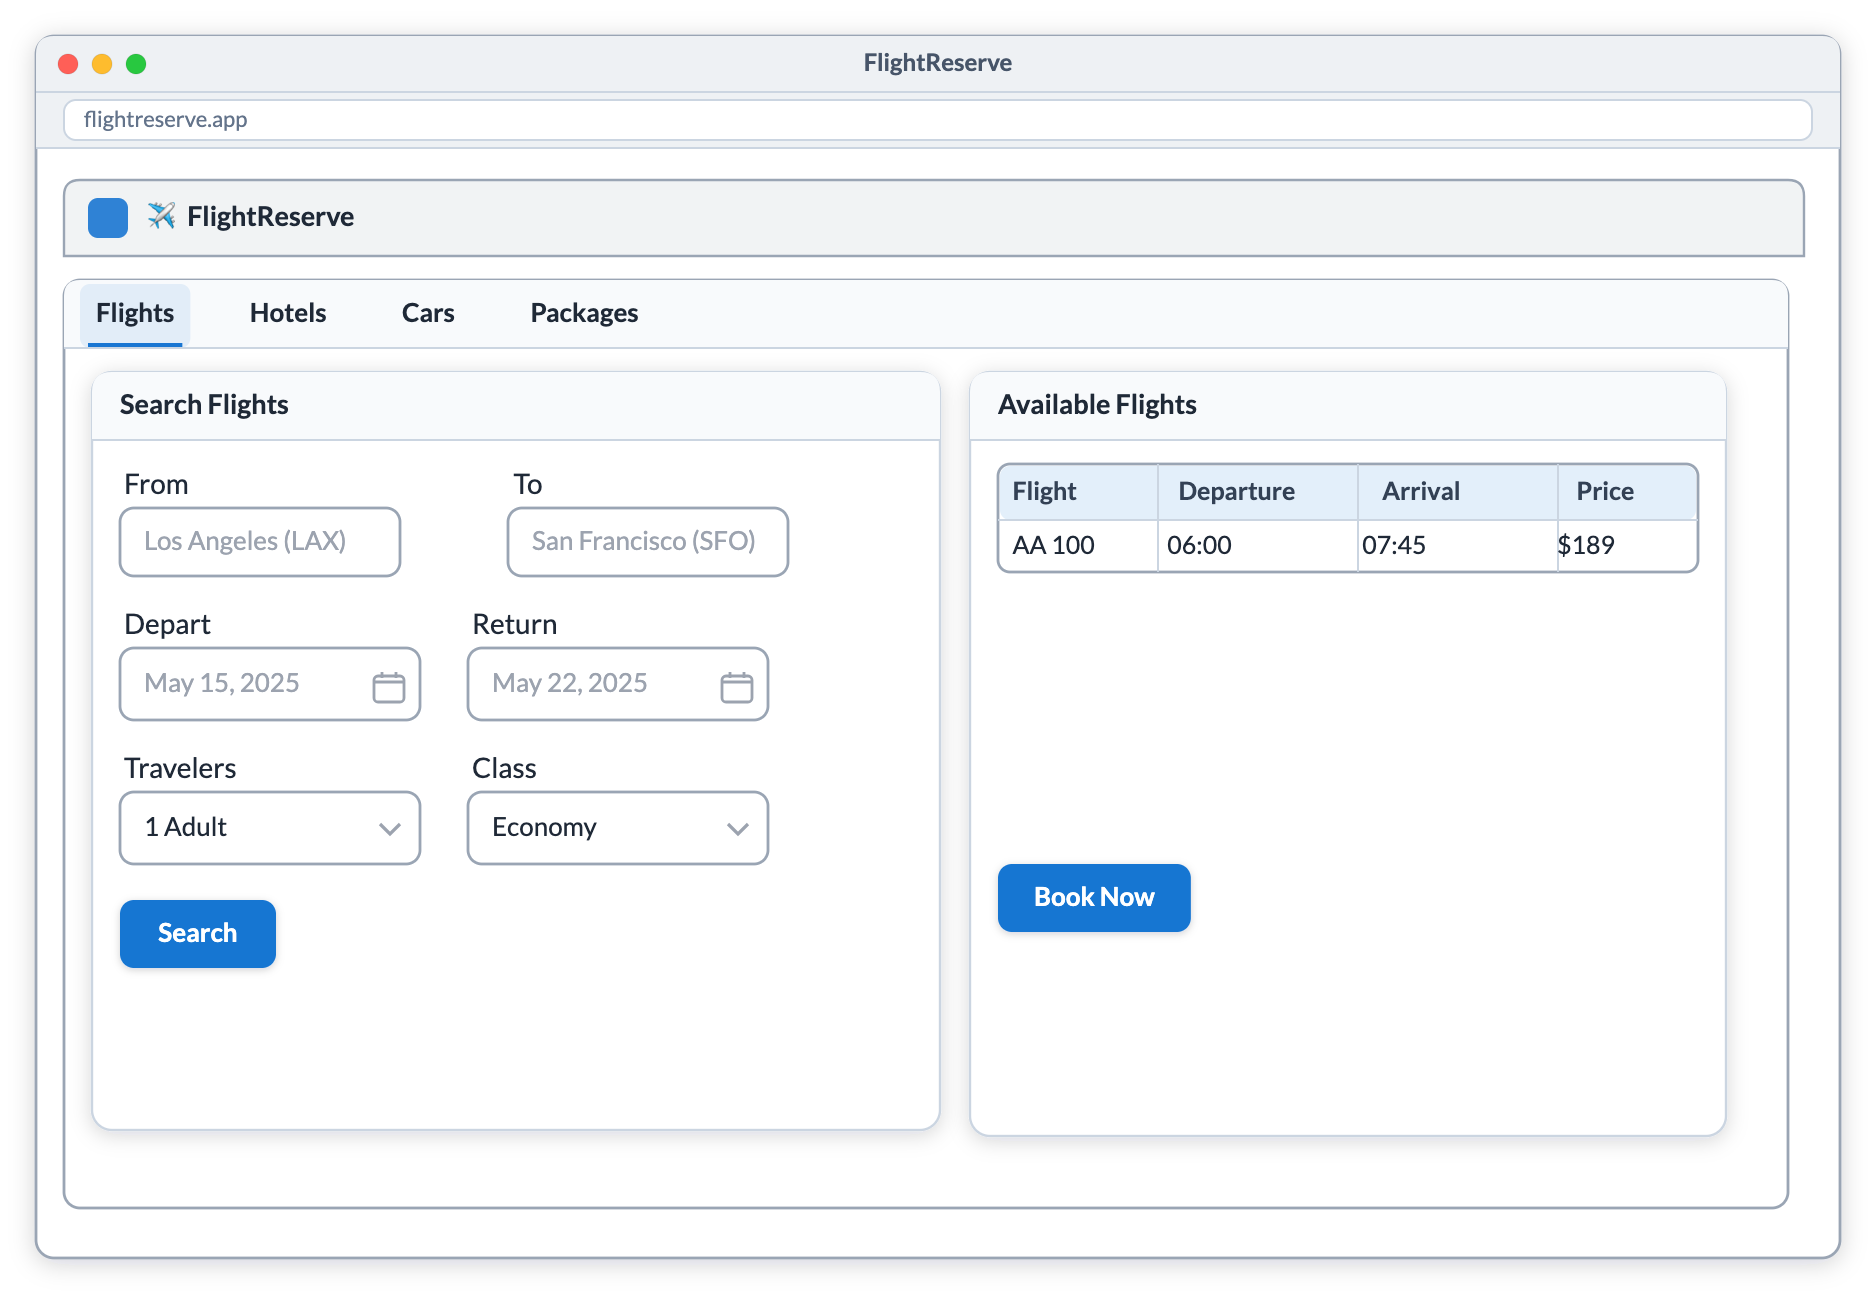
The UI category sketches interfaces with real widget semantics: a window with a title bar, a tab bar whose tabs switch the cards beneath them, cards grouping labels, text boxes, date pickers, dropdowns, buttons and tables. Widgets nest properly — drop a control on a card and it travels with it — so a mockup stays coherent as you rearrange.
8. Advanced diagram concepts
Tabs, splits and windows
Every open diagram is a tab. Drag a tab onto another tab strip to move it between groups, or to a canvas edge to split the workspace there — Eclipse-style tiled groups with draggable sashes, so a class model and its state machine can sit side by side. Drag a tab out of the window (or use the tab menu) to pop the diagram into its own browser window on a second monitor. The layout is part of your workspace and comes back on reload; the same diagram can even be open in several views at once.
Auto-layout
Auto-layout runs a real graph layout over the whole diagram — or over just the selection, which is the everyday form: tidy one corner you just roughed in without touching the rest. Class, state and schema diagrams get layered layouts; concept maps re-arrange their tree. Every layout is one undo step.
Export and import
The Export menu covers interchange and publication: PNG (whole diagram or any subdiagram region), the diagram's JSON, Mermaid and PlantUML text for docs and wikis, and OPML for mind maps (both directions with outliners). Text exports open in the built-in markdown window for copying; Import auto-detects Mermaid, PlantUML or OPML on paste and builds the native diagram, laid out properly.
Variables and the watcher
Diagrams can compute. Variables live at two levels — on the project (shared by every diagram) and on the diagram (local, shadowing a same-named project variable) — and are managed from the canvas menu:
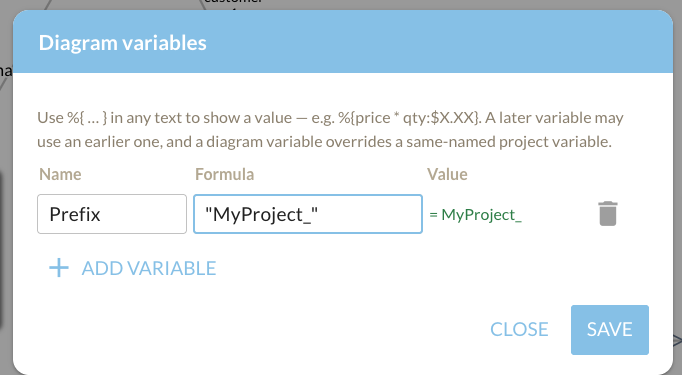
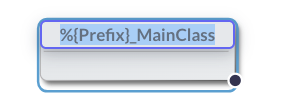
Any text on the canvas can embed %{…} formulas — a variable name, arithmetic, or a formatted expression like %{price * qty:$X.XX}; later variables can use earlier ones. The text renders with values substituted:
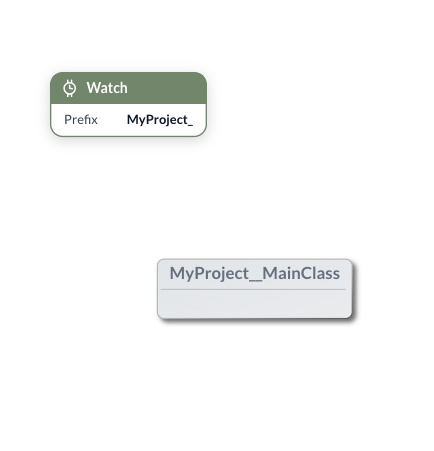
The variable watcher (on the Global row of the Shift grid) is a small widget listing chosen variables with their live values — drop one next to whatever the variables drive to see calculations update as you edit. Watches refer to variables by name, so renaming a variable orphans its watch deliberately.
9. Working with AI
The assistant lives in a chat panel beside the canvas, reads the diagrams in your project, and edits them with the same operations you use — so everything it does is visible, adjustable and undoable.
Creating diagrams
Describe what you want and where: “create a mind map of the flight reservation system's functionality” produces a structured map on the current canvas; follow up conversationally — “add a branch for loyalty”, “make it an infographic” — and it refines in place.
Reverse-engineering a class model
Paste code (or point it at classes you describe) and ask for the model: the assistant extracts the classes, attributes, operations and relationships and draws the UML for you — the quickest route from an unfamiliar codebase to a shared picture. The same works for schemas from DDL and sequences from logs or descriptions.
Creating code
The reverse direction too: ask for “Python dataclasses for this domain model” or “SQL DDL for this schema” and the assistant reads the diagram's pure model and writes the code in chat, ready to copy.
Markdown and Mermaid
Answers that come back as documents — markdown briefs, Mermaid diagrams, tables — open in the floating markdown window, rendered properly (Mermaid included). Export ▸ Mermaid/PlantUML reuse the same window, and a Mermaid snippet the AI wrote can be imported straight back onto a canvas as native shapes.
Your personal expert — coming soon
Vectorised documents are on the way: upload your manuals, standards and design docs, and the assistant answers with your organisation's own material — turning it from a general modeller into your expert.
10. Team collaboration
Projects are shared spaces. Invite someone to a project and its diagrams appear for them; edits sync live in both directions, shape by shape, with each person's undo history kept to their own changes. There is no lock to take and no merge to run — two people can work the same diagram at once.
Presence shows who's here: avatars in the header for everyone in the project, on each diagram tab for the people viewing it, and live cursors on the canvas while they edit. A diagram rename or description edit updates for everyone instantly.
The team chat window gives each project a running conversation — messages with emoji reactions, kept with the project so the discussion is there the next time anyone opens it. Chat about a diagram while standing on it: your presence already says which diagram you mean.
11. Pure model schemas
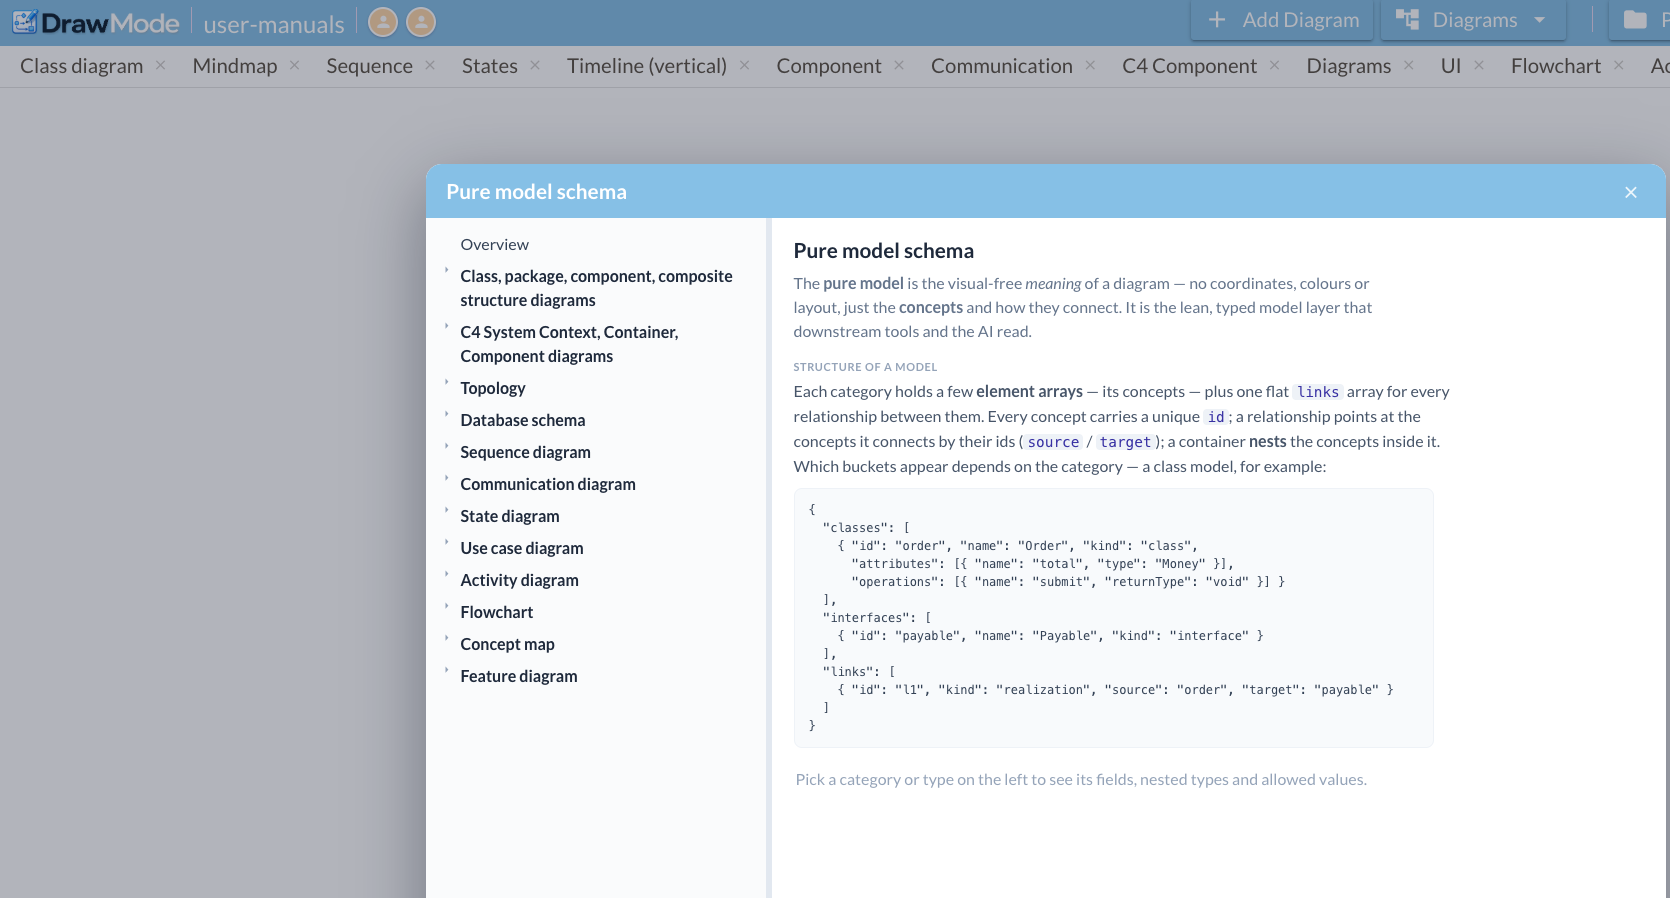
Underneath every diagram is a pure model — the diagram's meaning with the visuals removed. No coordinates, no colours, no layout: just typed concepts and how they interconnect. Each category has a small schema — a class model is classes and interfaces with attributes and operations plus a flat links array; every concept carries an id, every link points at ids; containers nest their children.
Right-click the DrawMode logo → Pure model schema to browse it: the overview explains the structure, and each category page lists its concepts, fields, nested types and allowed values. Export ▸ Pure model downloads a diagram in exactly this form — the right input for code generators, analysers and AI tools.
12. Diagram schemas
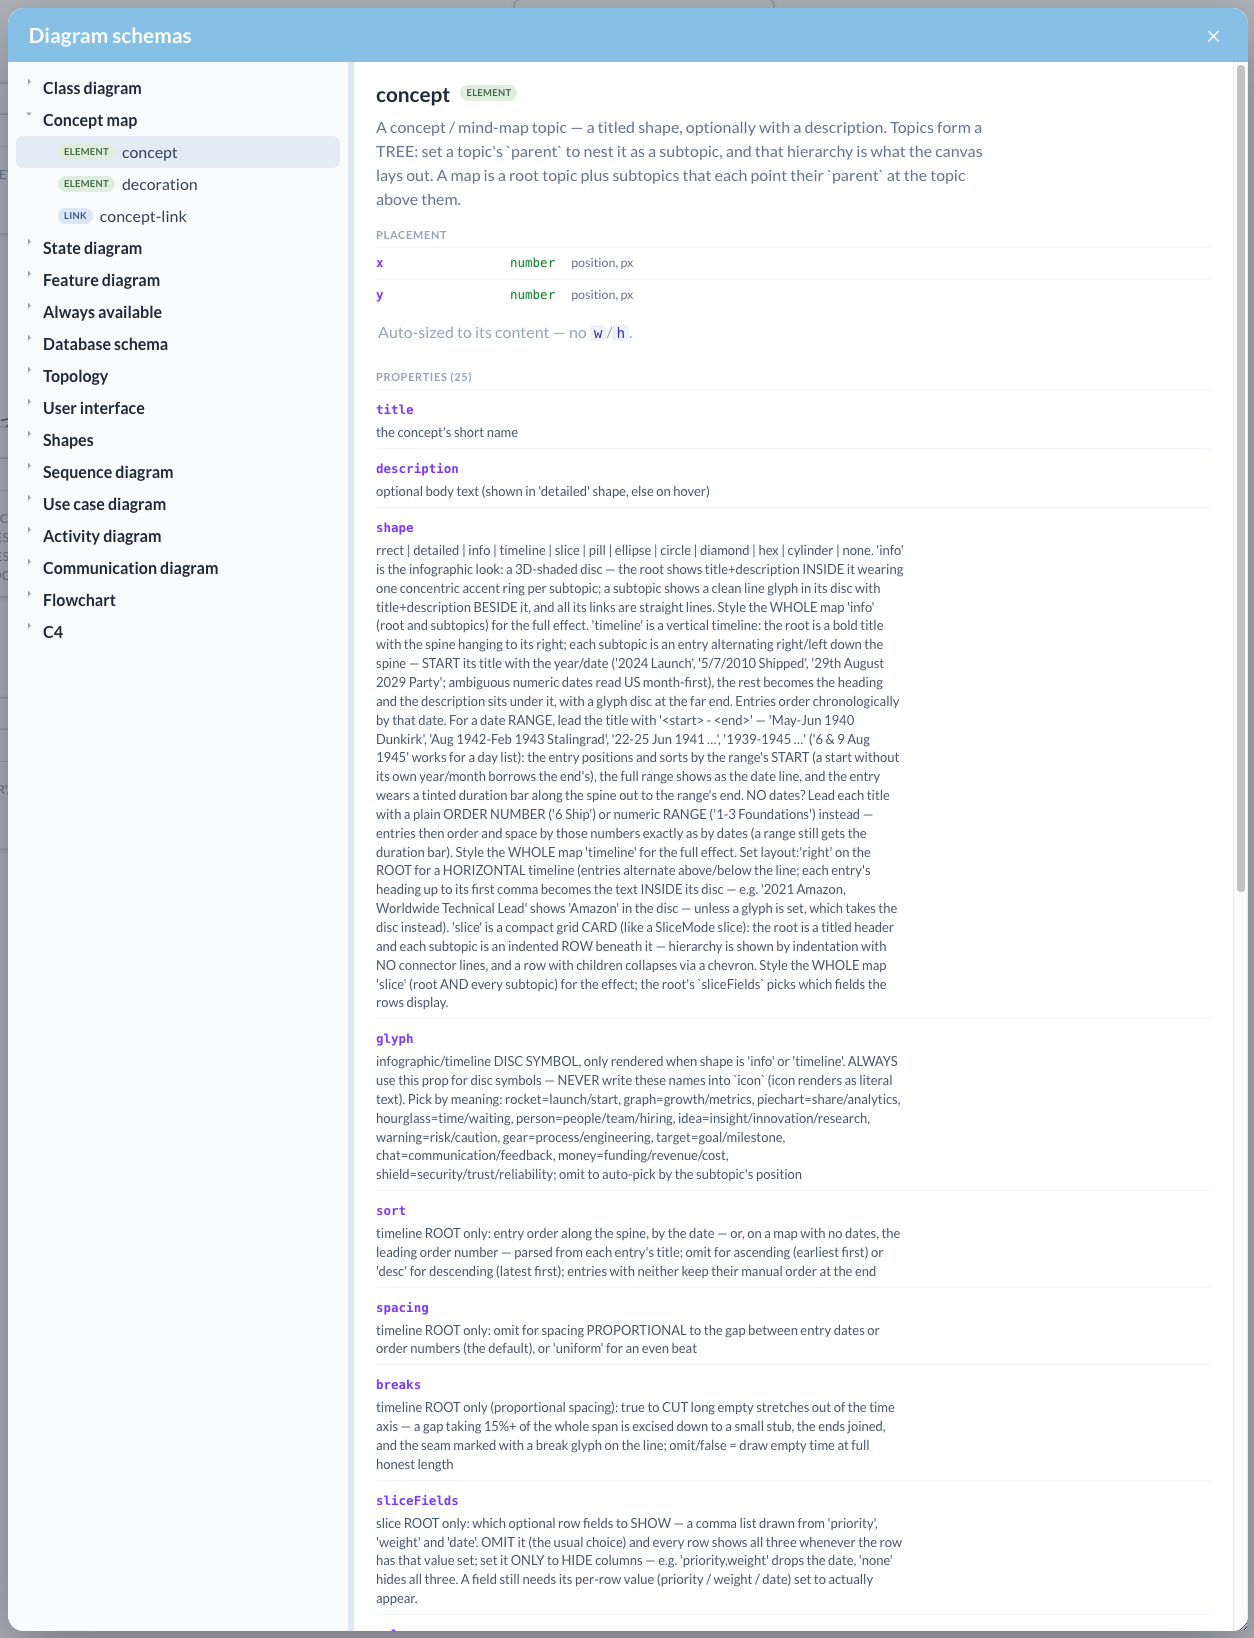
The full diagram schema is the other half of the story: the domain model of the diagrams themselves, straight from the shape registry. Every category page lists its element and link types with all their properties — placement, sizing, colours, presentation modes, glyph vocabularies, spacing rules. It's the schema of what the canvas can draw.
Right-click the DrawMode logo → Diagram schemas to browse it. The concept element alone carries some twenty-five properties, most of them visual — which is precisely the point of the previous section: diagrams encode a great deal of presentation that you only need if you want the full picture back. If you want the information, use the pure model — far simpler, and far denser in meaning.