DrawMode is a diagramming tool built on three convictions: it is AI-native,
it is web-native, and team collaboration is the normal way of
working, not an add-on. Diagrams live in shared projects; edits land live for everyone, and the
built-in assistant reads and writes the same diagrams you do — create a mind map from a prompt,
reverse-engineer a class model from code, or hand a rough sketch to the AI for the rigour.
Modelling tools used to demand precision up front — every box placed, every line routed.
DrawMode lowers the ceremony and friction instead: hold Shift for the creation palette, release on
a tile, and the right shape lands under your cursor; layouts arrange themselves; gentle alignment
guides do the tidying. One page can mix categories freely — classes beside mind maps beside free
shapes — and everything exports cleanly: PNG, Mermaid, PlantUML, OPML, or a typed
pure model for code generators and AI tools downstream.
Every screenshot below is a live DrawMode diagram from the user manual —
click any of them for a closer look.
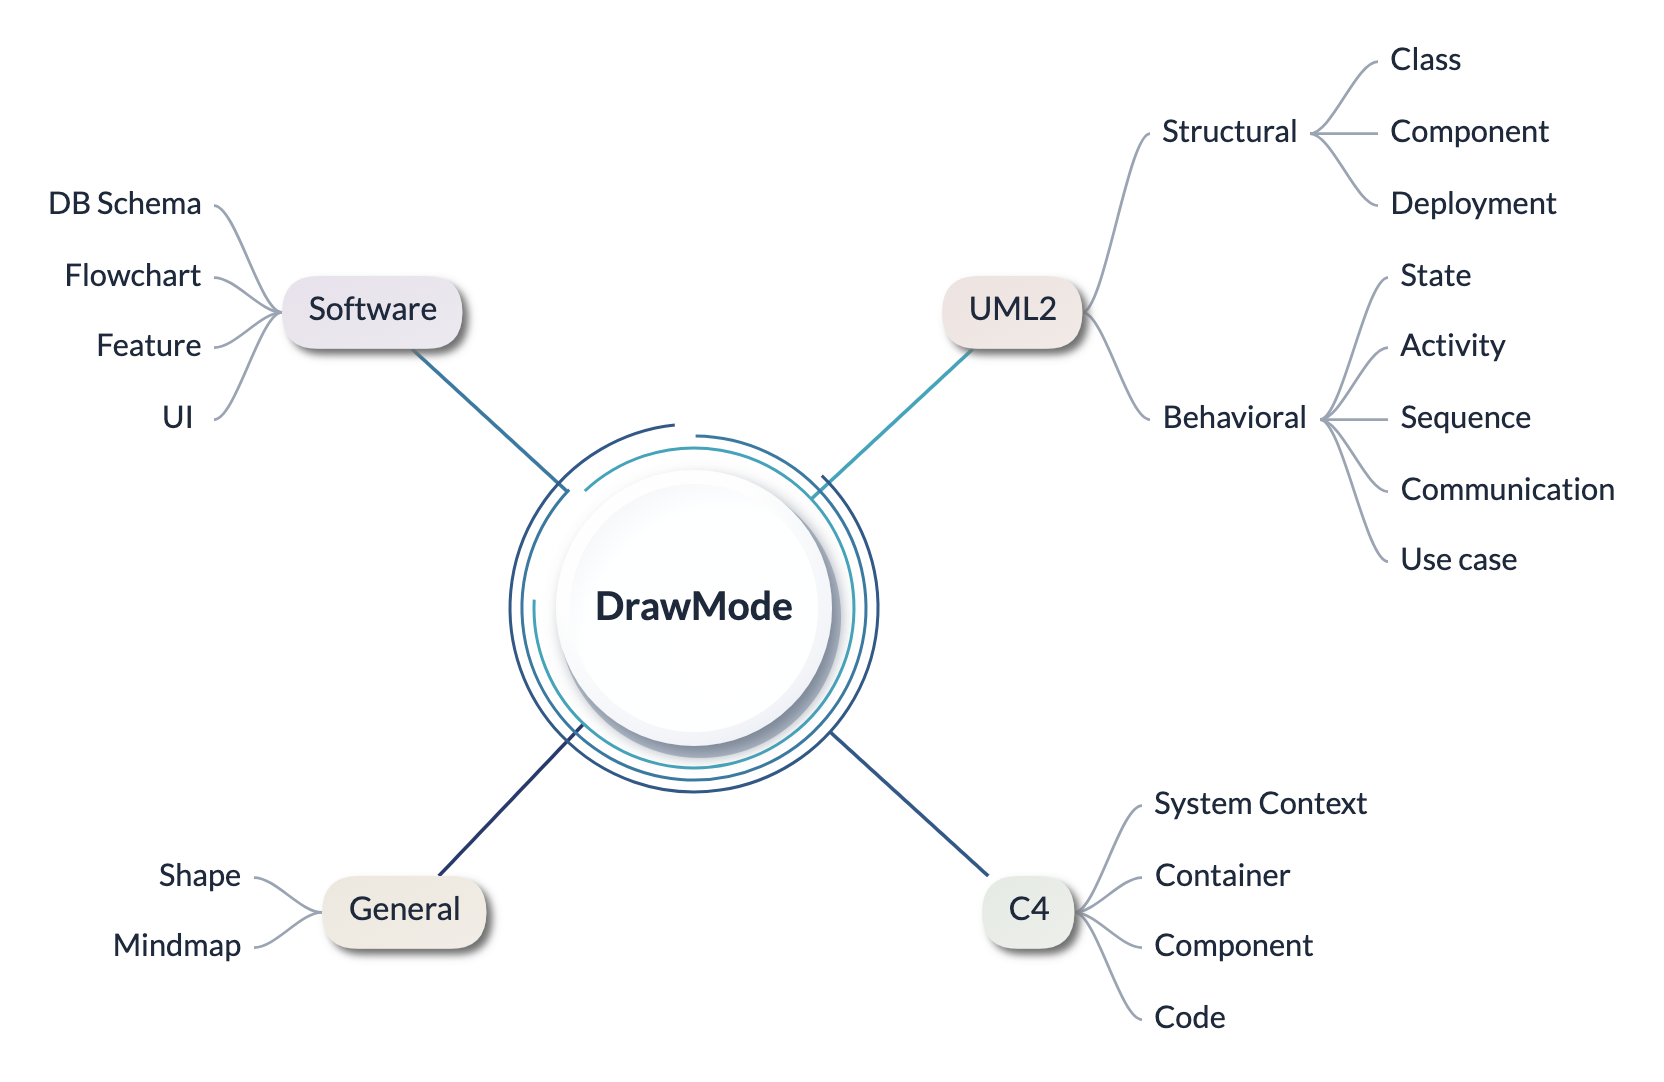
The DrawMode rangeA mind-map infographic of the diagrams DrawMode supports — General drawing, UML 2,
the C4 views and the software family, radiating from one hub. Drawn, of course, in
DrawMode.
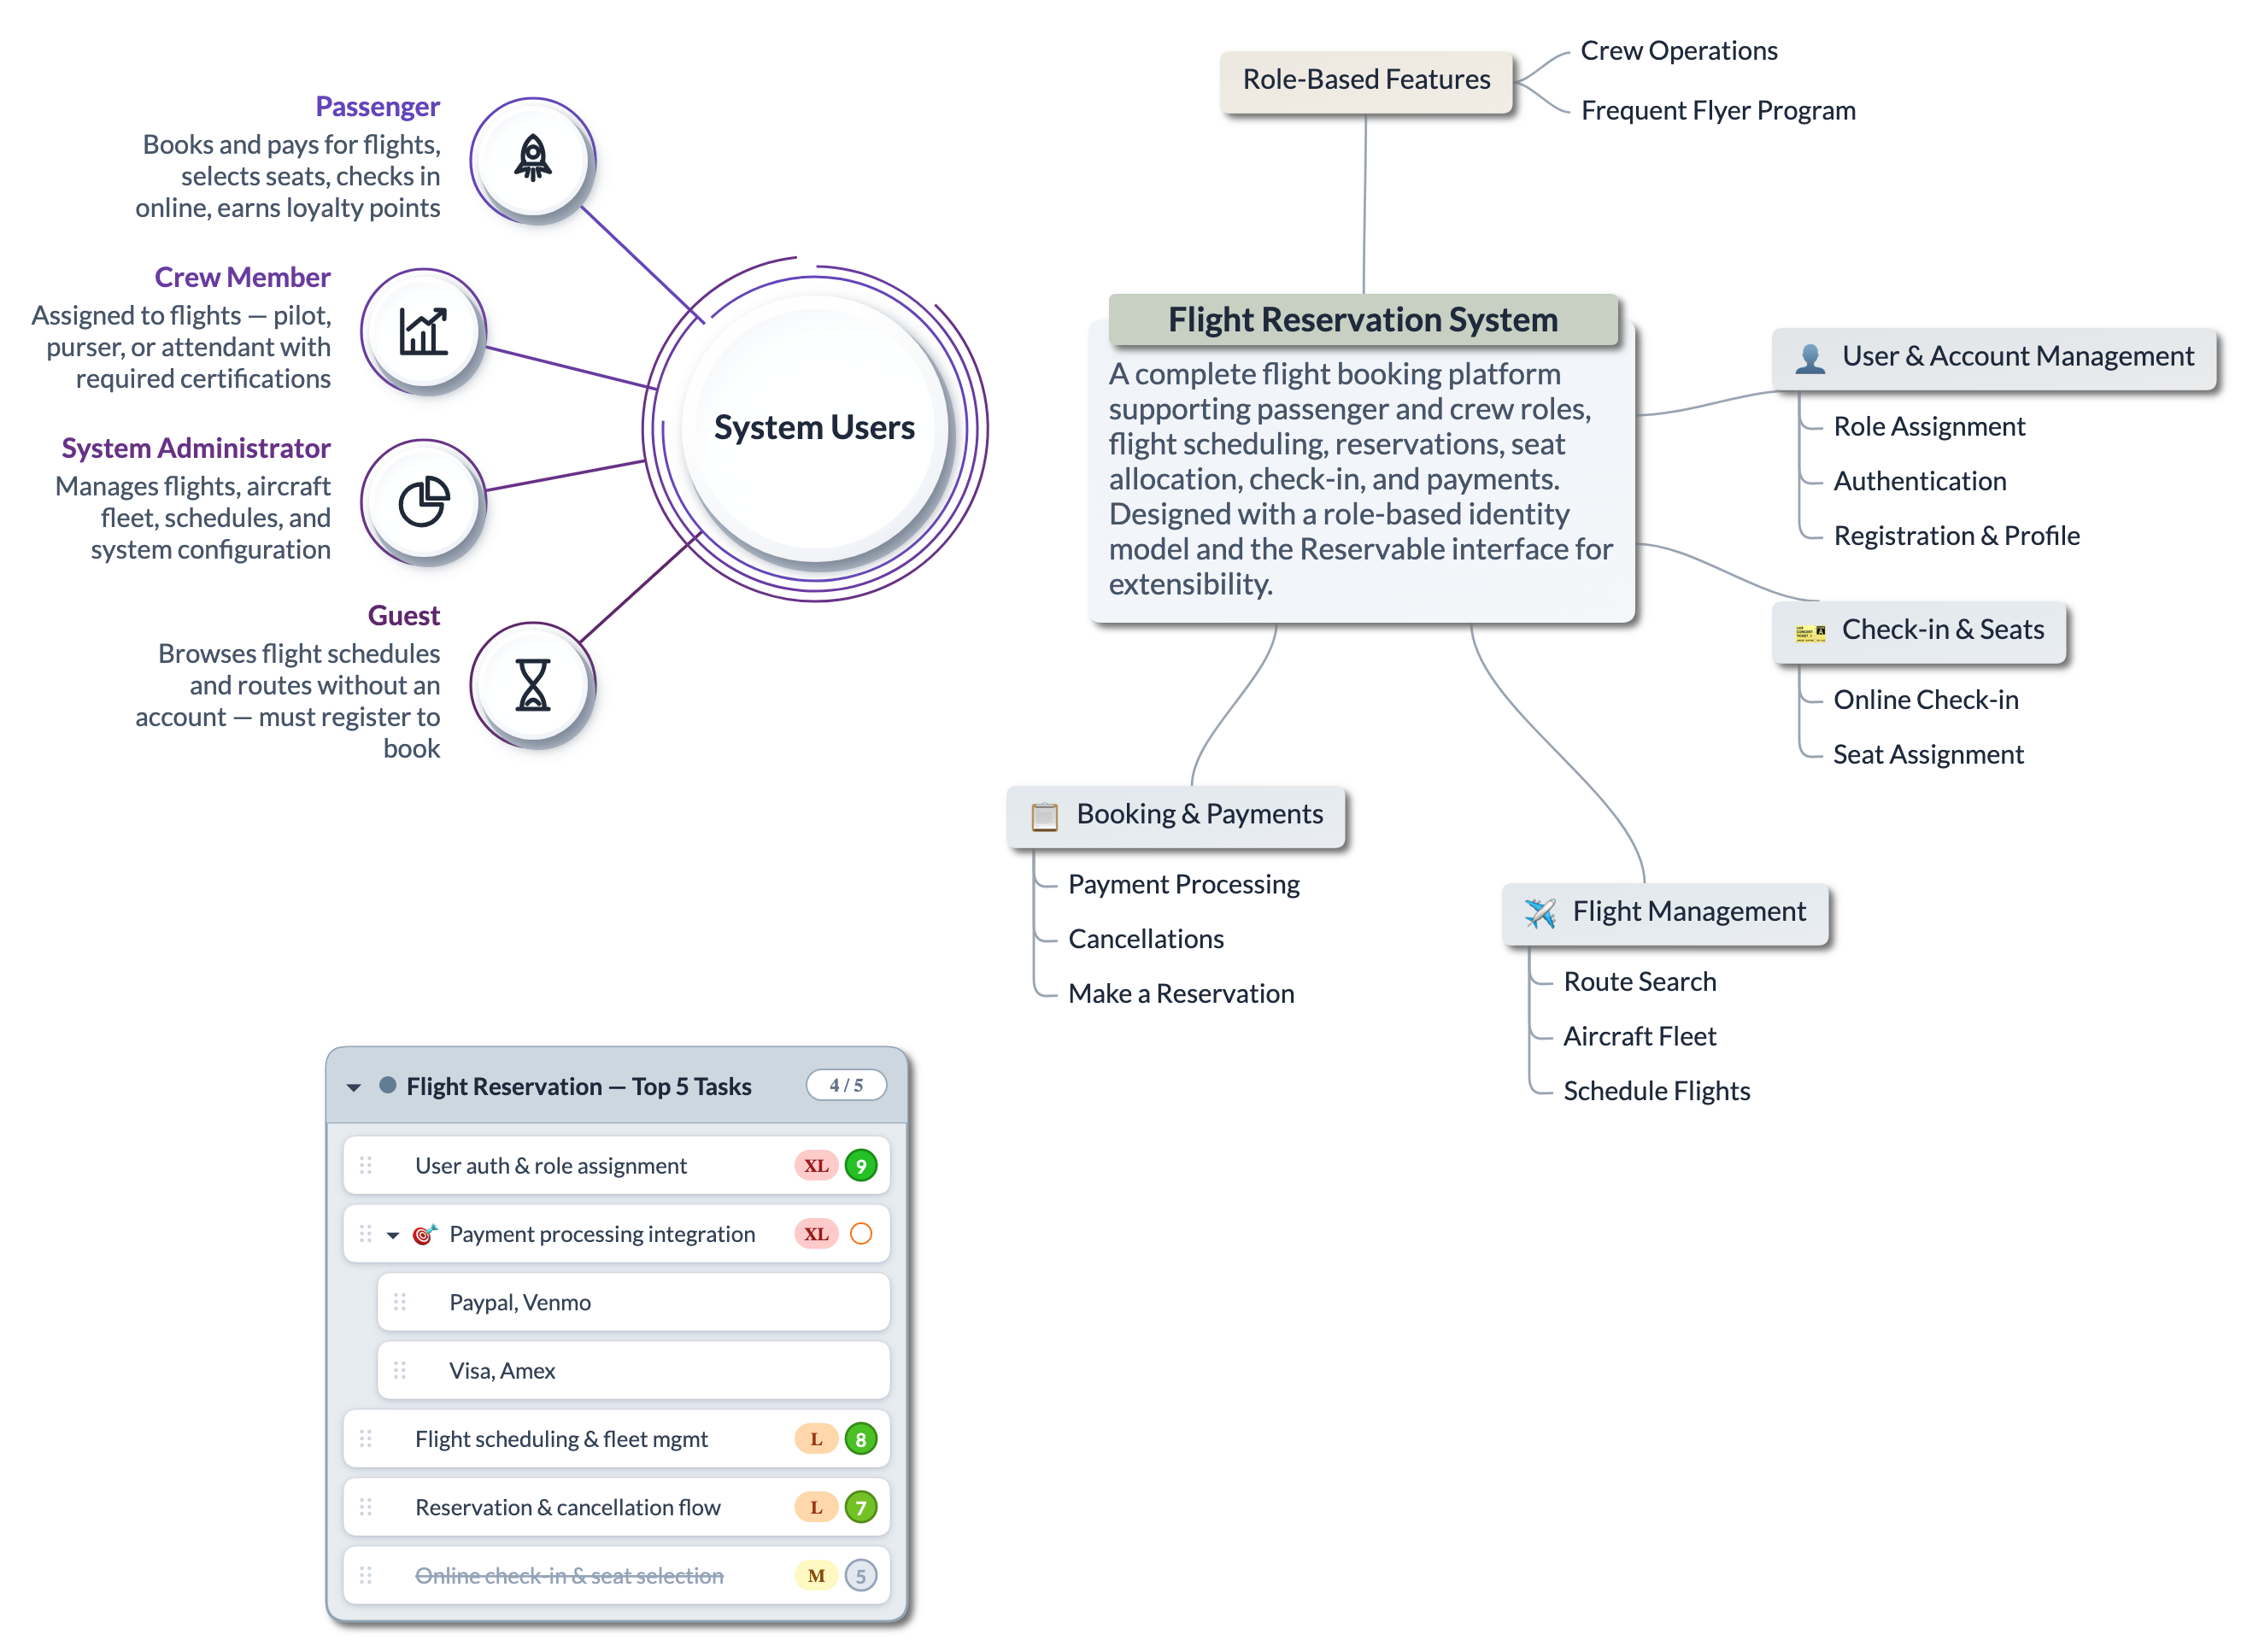
Mind mapOne hierarchical model with interchangeable presentations — a classic map, an
infographic radial and a to-do card share this single page. The fastest way from
brainstorm to structured plan.
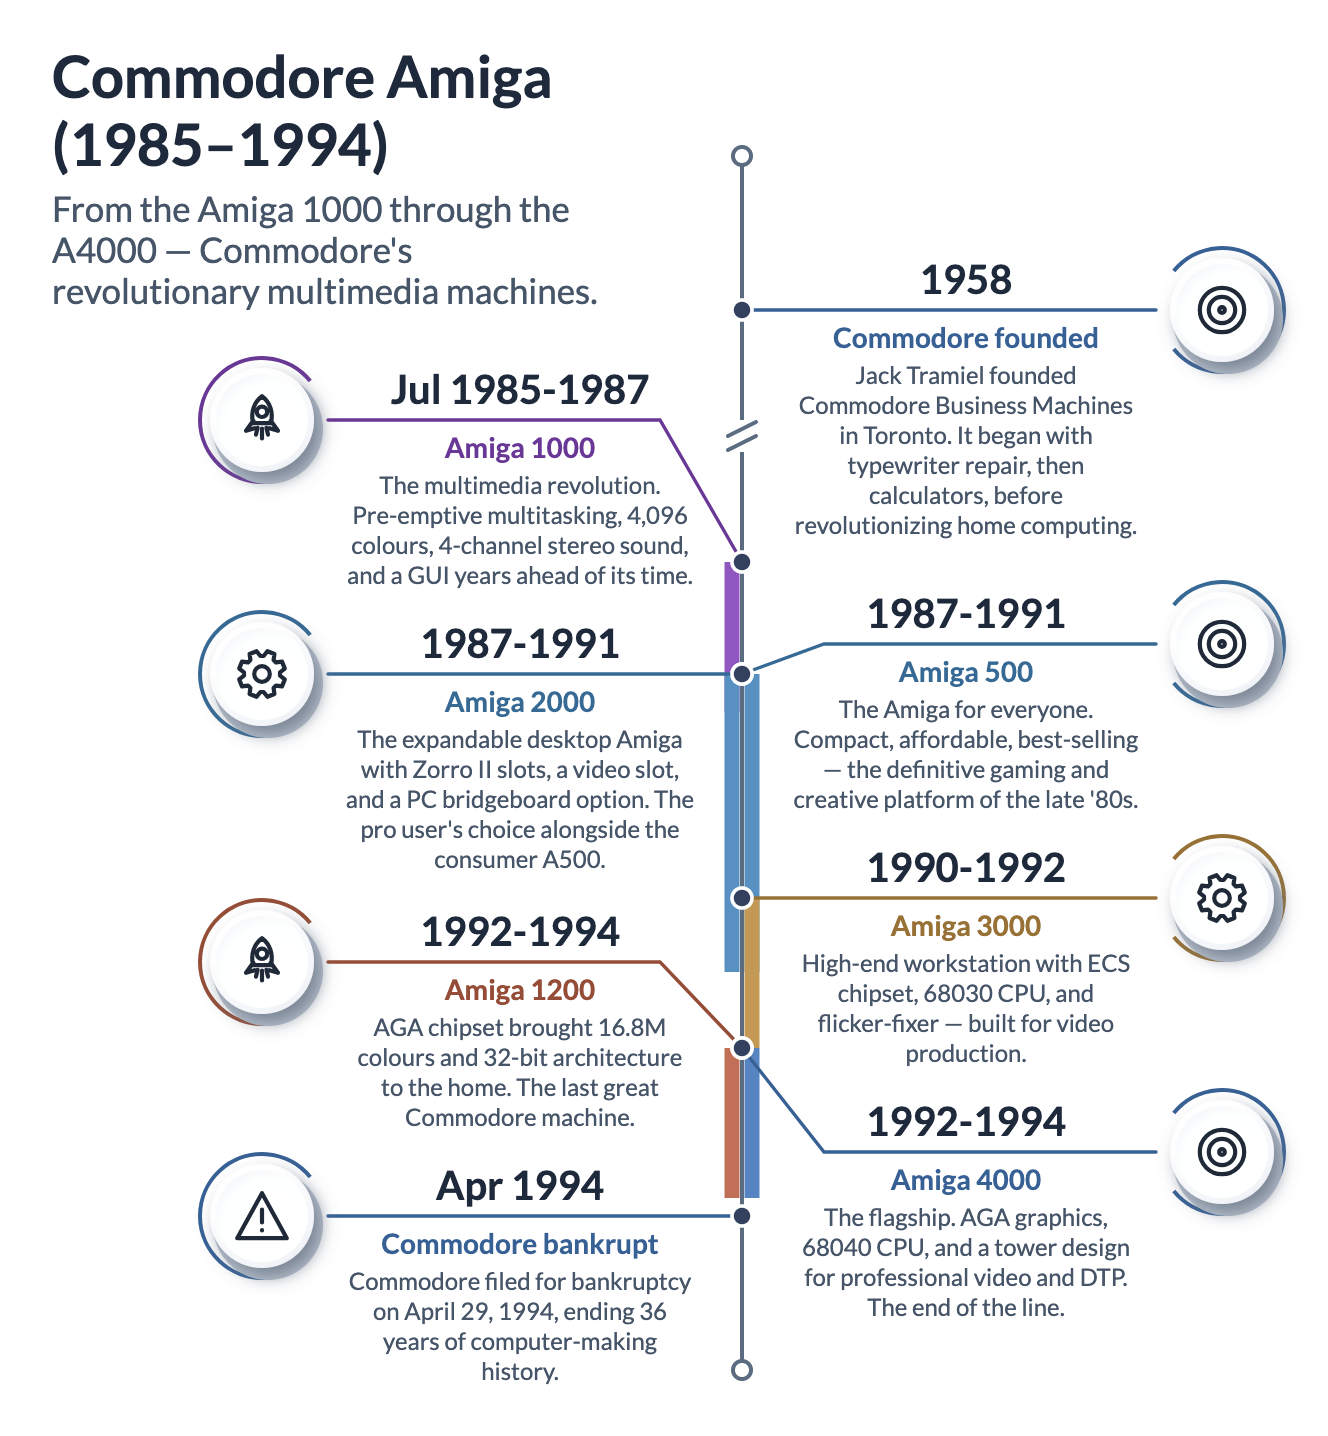
Timeline (vertical)Date-led topics become a chronology automatically: entries order and space themselves,
ranges wear duration bars, and long empty stretches are cut with a marked break.
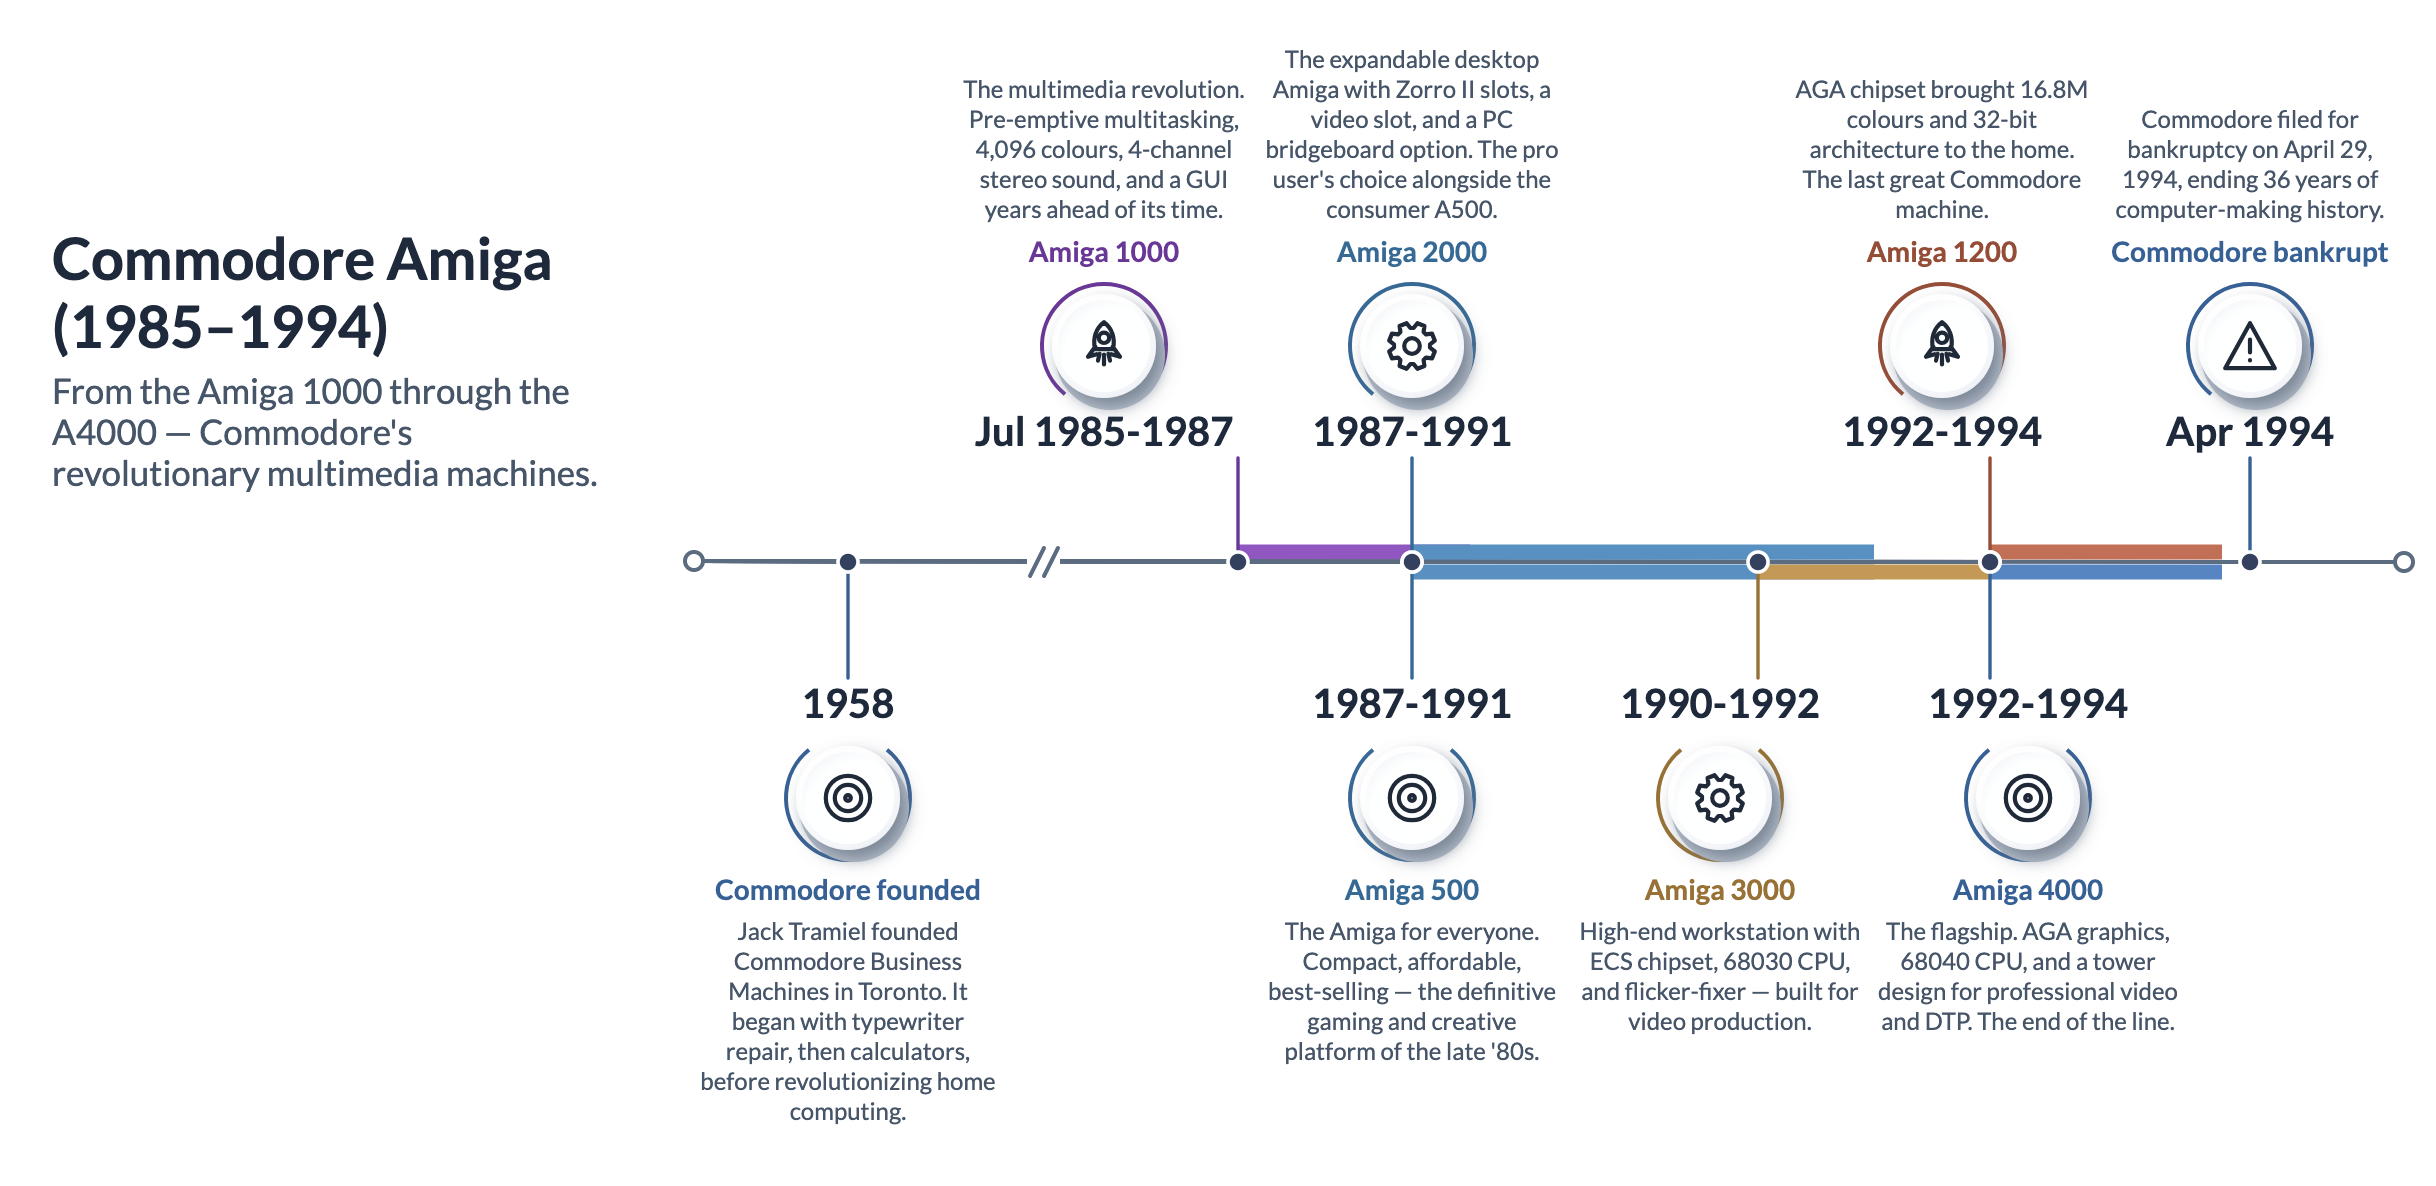
Timeline (horizontal)The same timeline model laid across the page — ideal for slides and wide
displays.
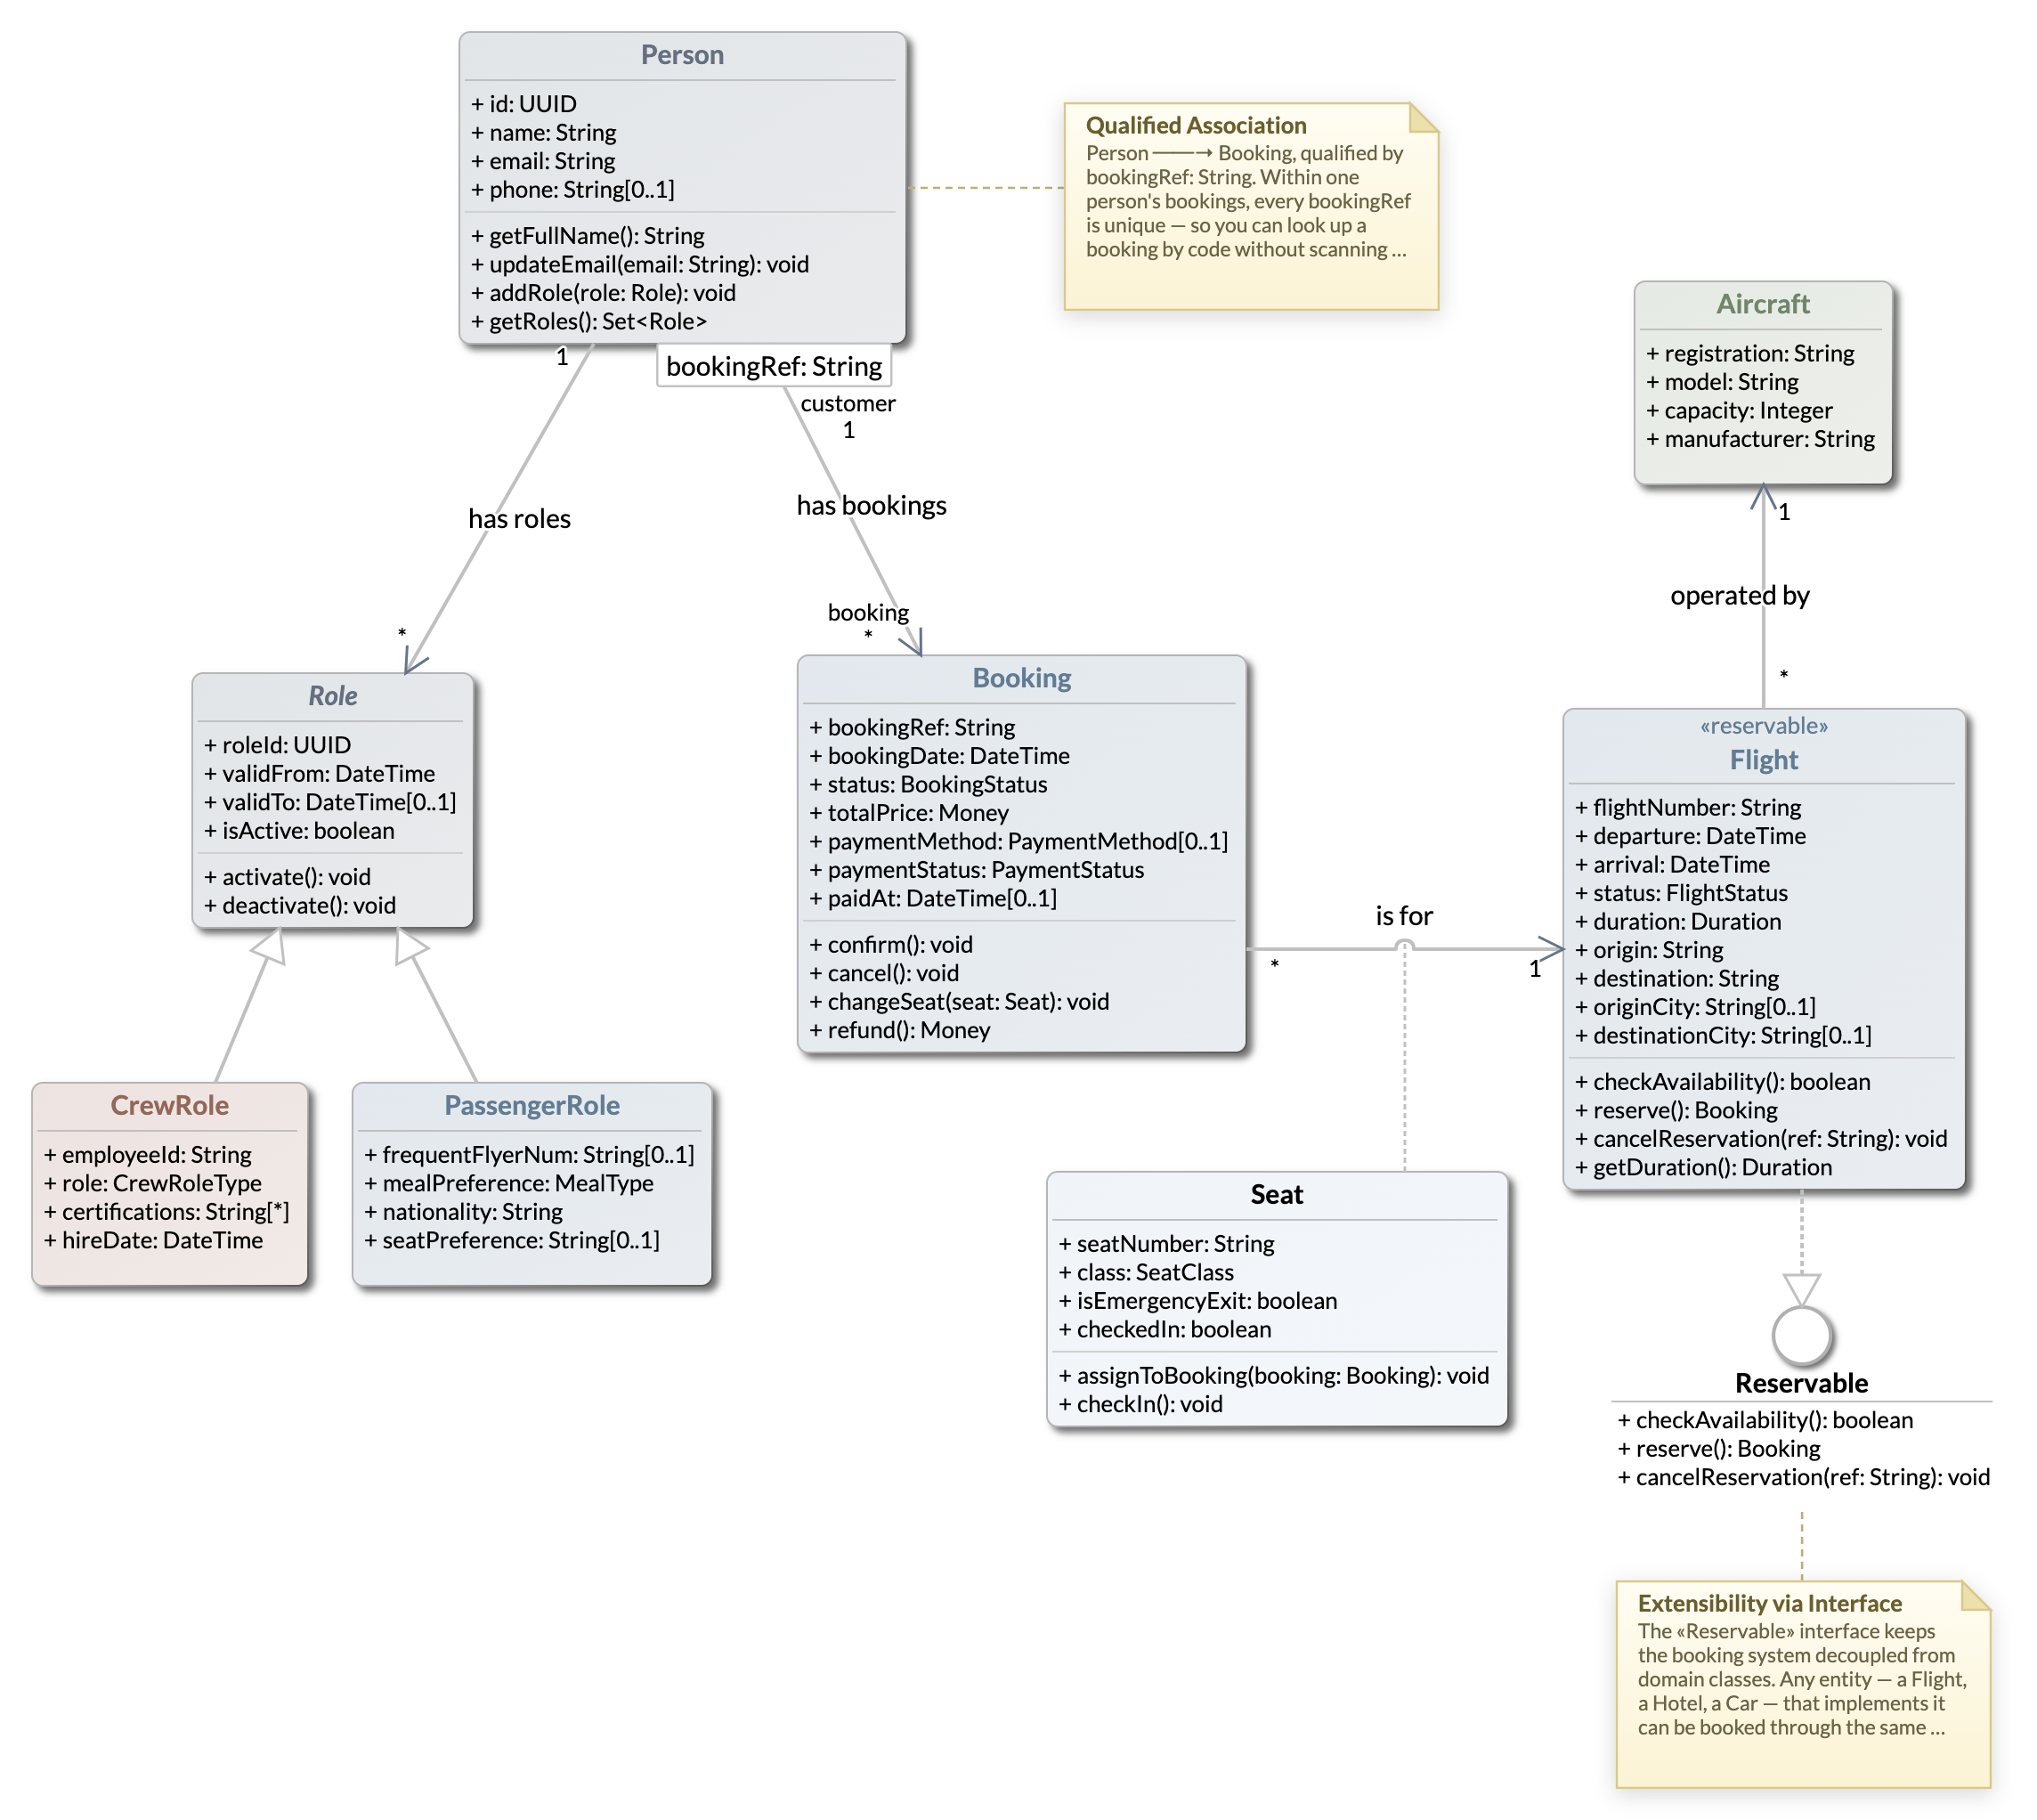
Class diagramThe structural backbone of a system: classes, attributes, operations and the six UML
relationships, plus interfaces, qualified associations and association classes. The shared
vocabulary for a domain model.
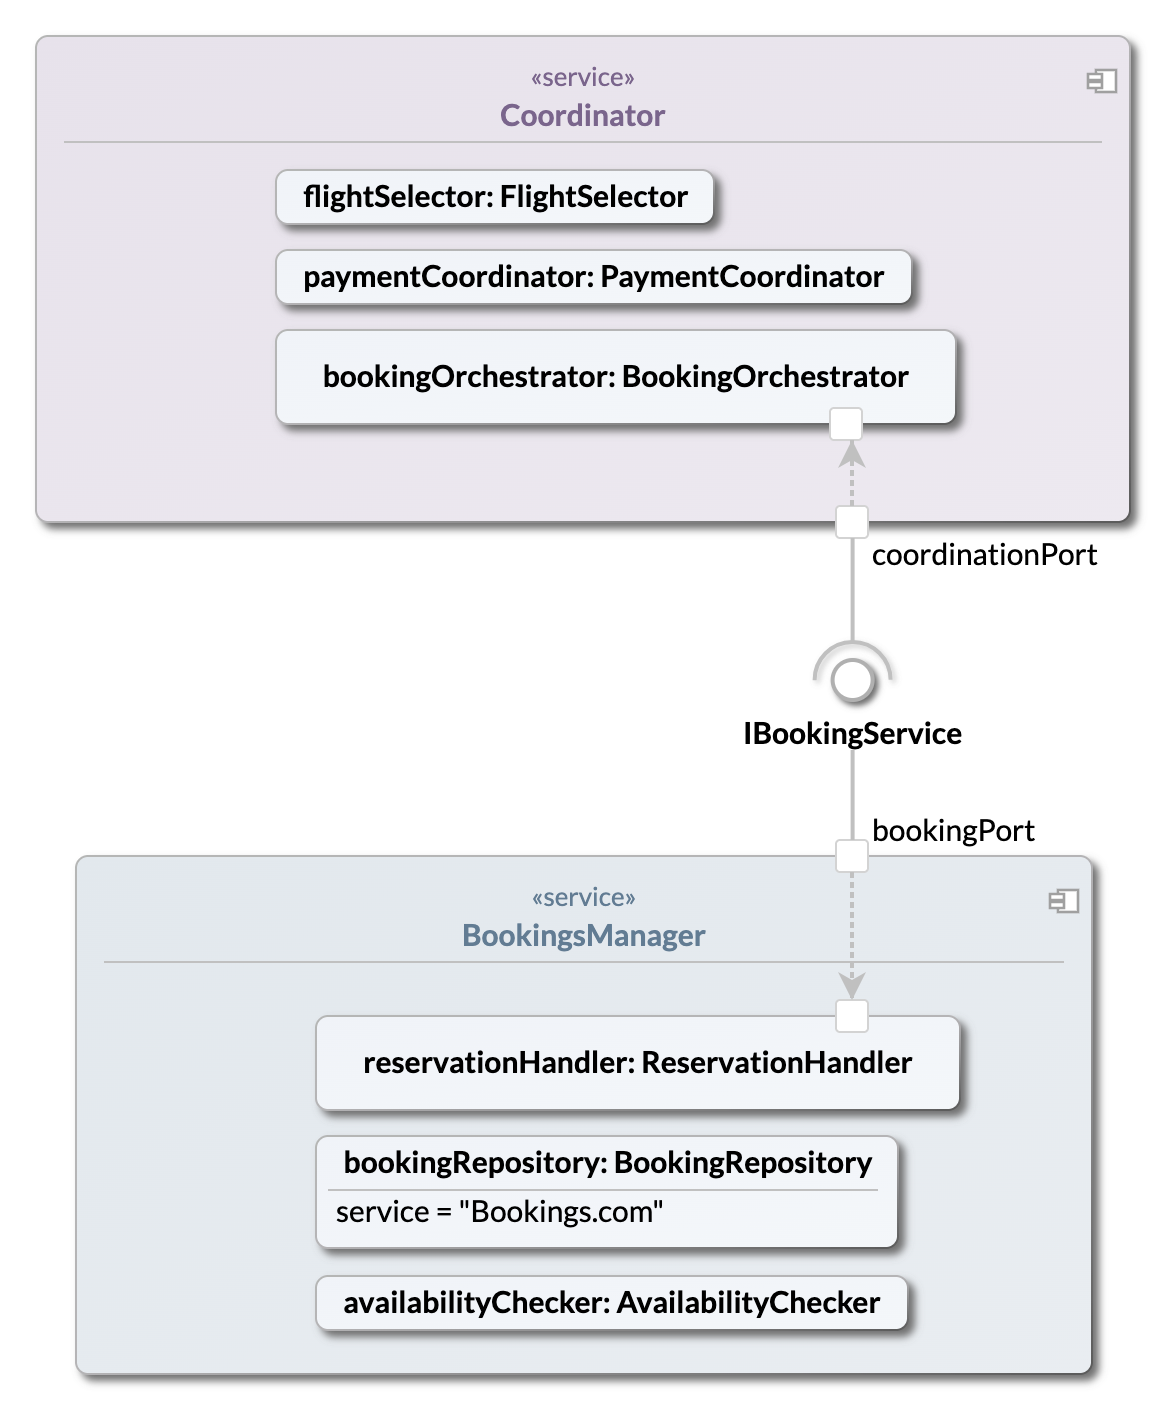
Component diagramHow a system splits into replaceable parts: composite classifiers with internal parts,
border ports, delegation, and provided/required interfaces wiring them together.
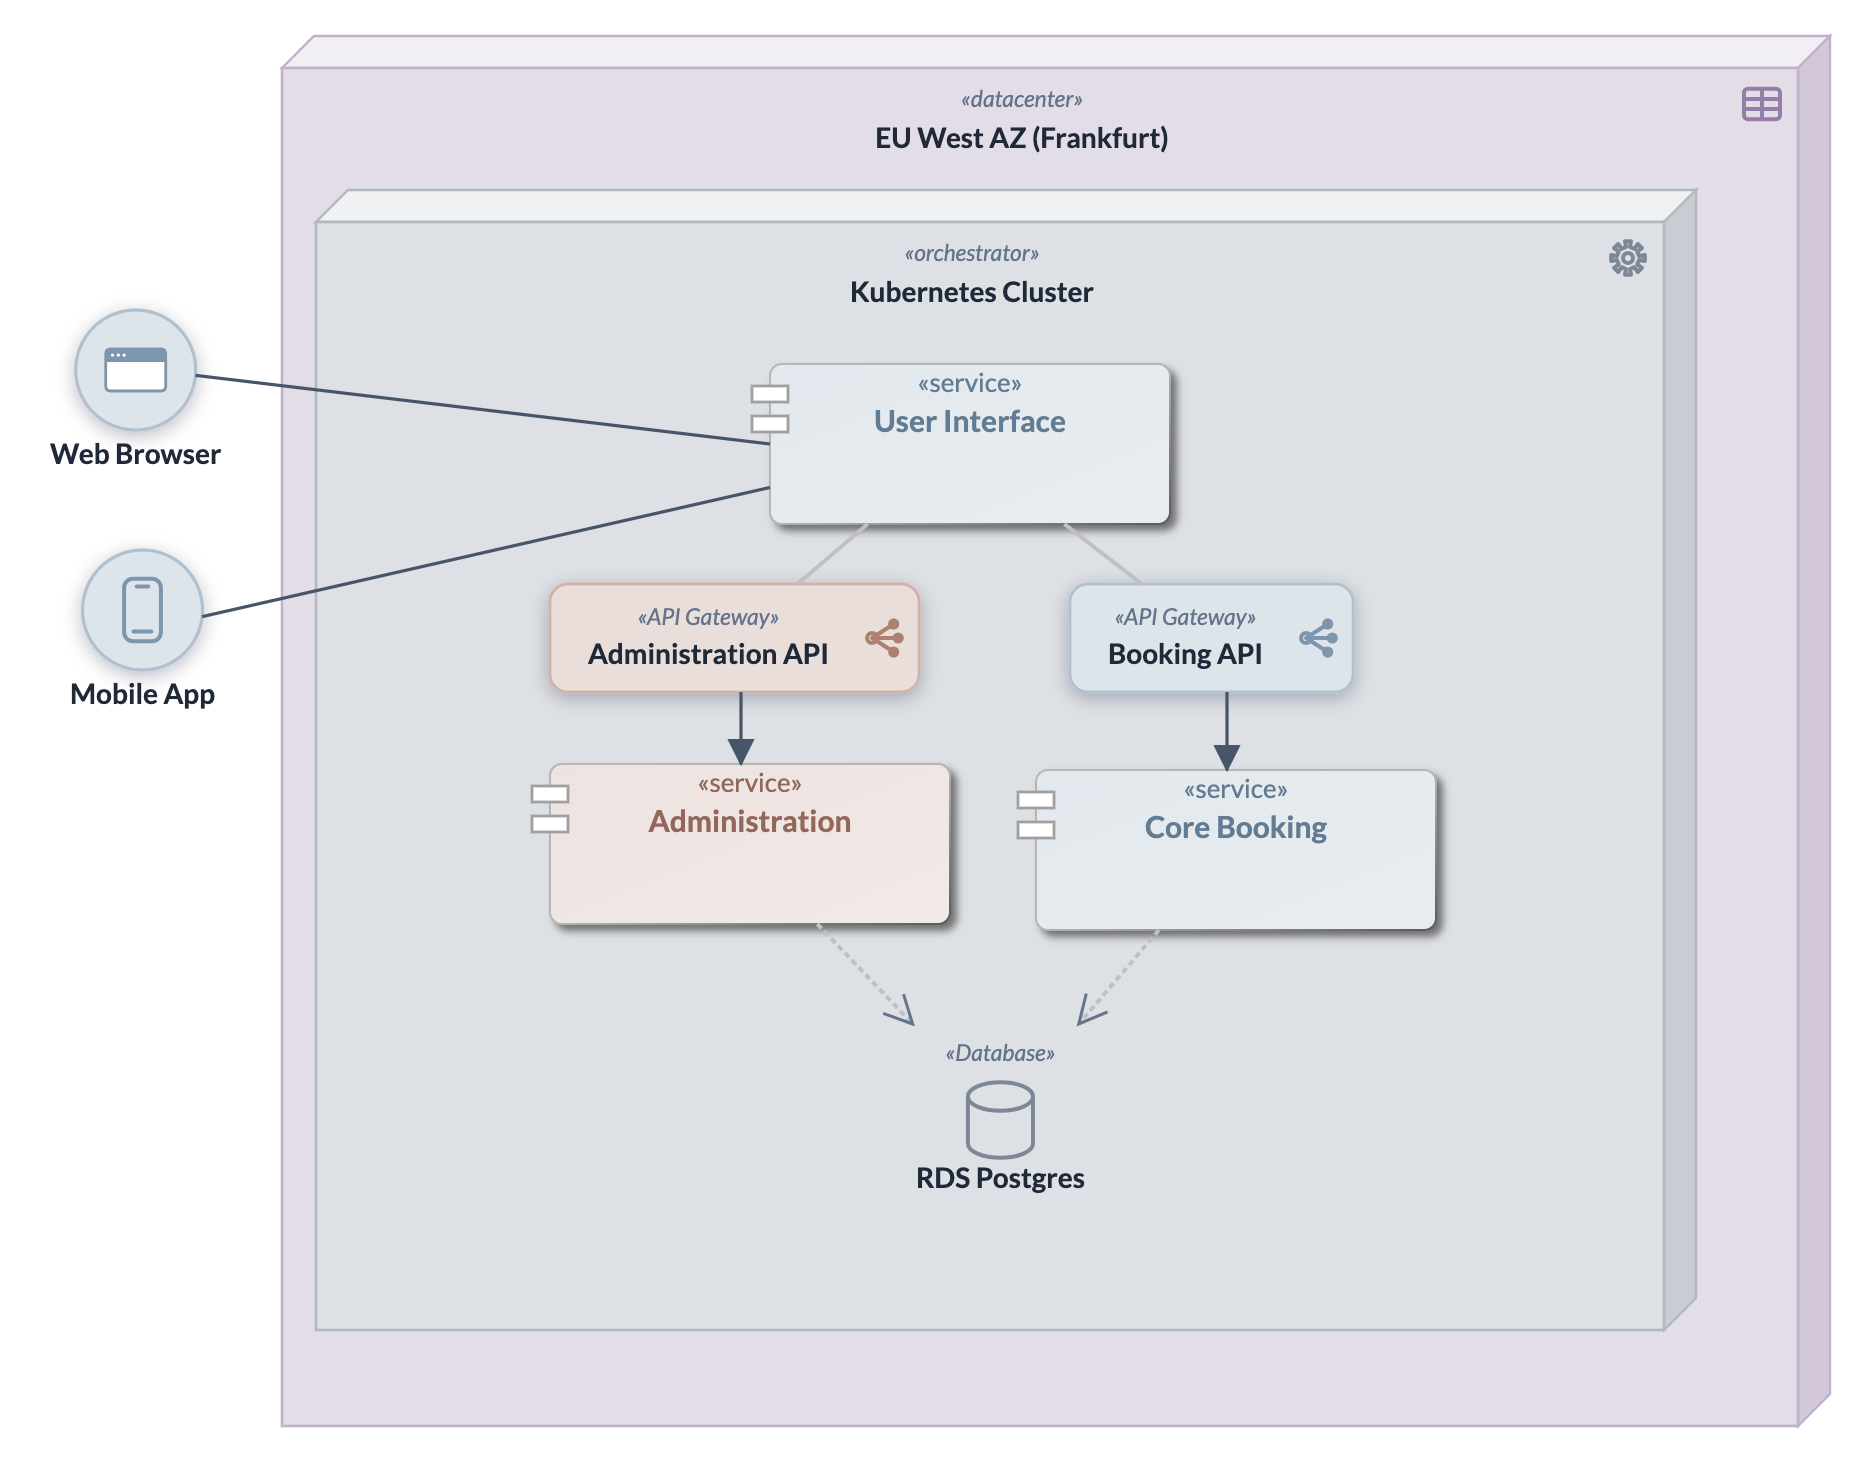
Deployment diagramWhere the software runs — 3-D nodes for execution environments, infrastructure
elements, client devices and the communication paths between them.
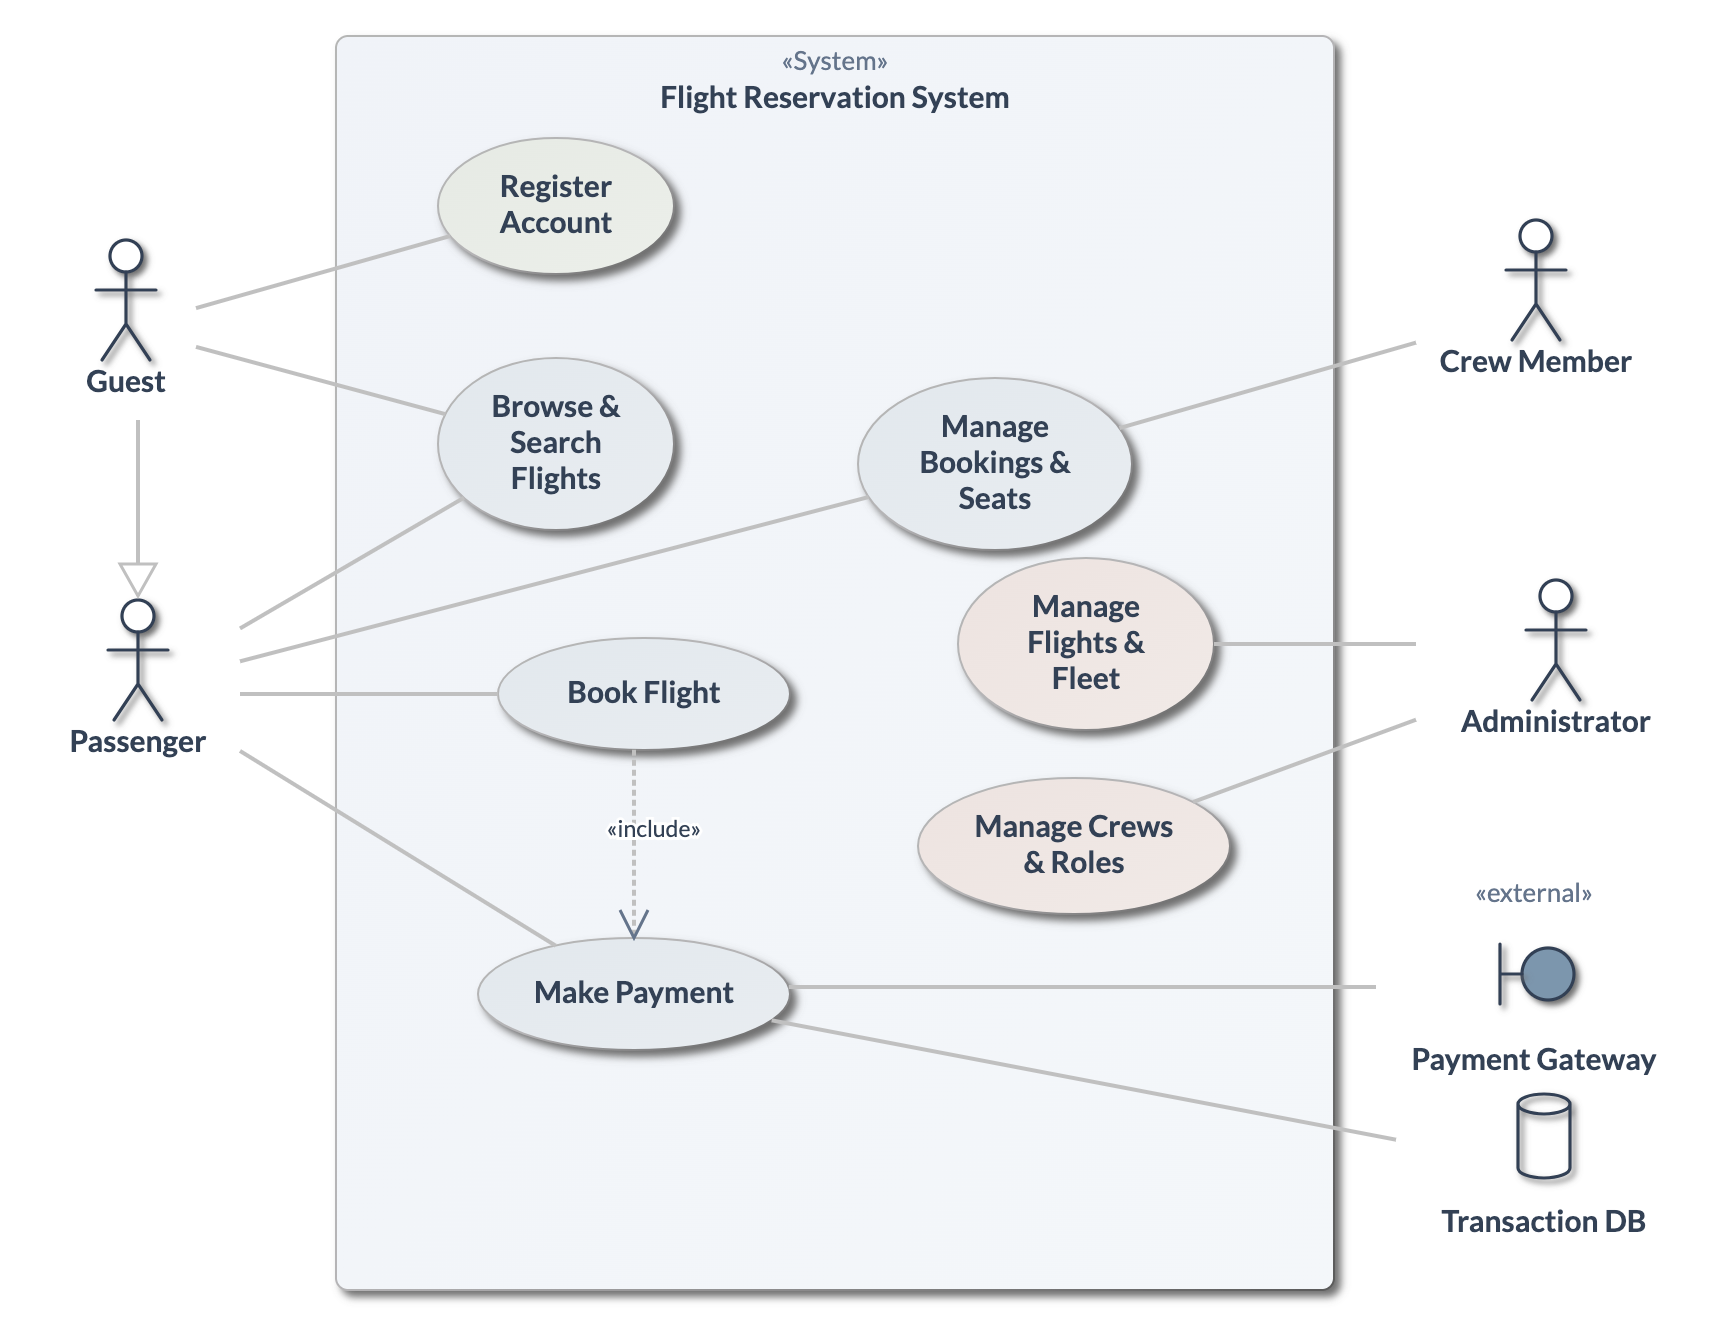
Use case diagramWhat the system is for and for whom: actors (with inheritance) around a subject
boundary of use cases — the scope conversation on one page.
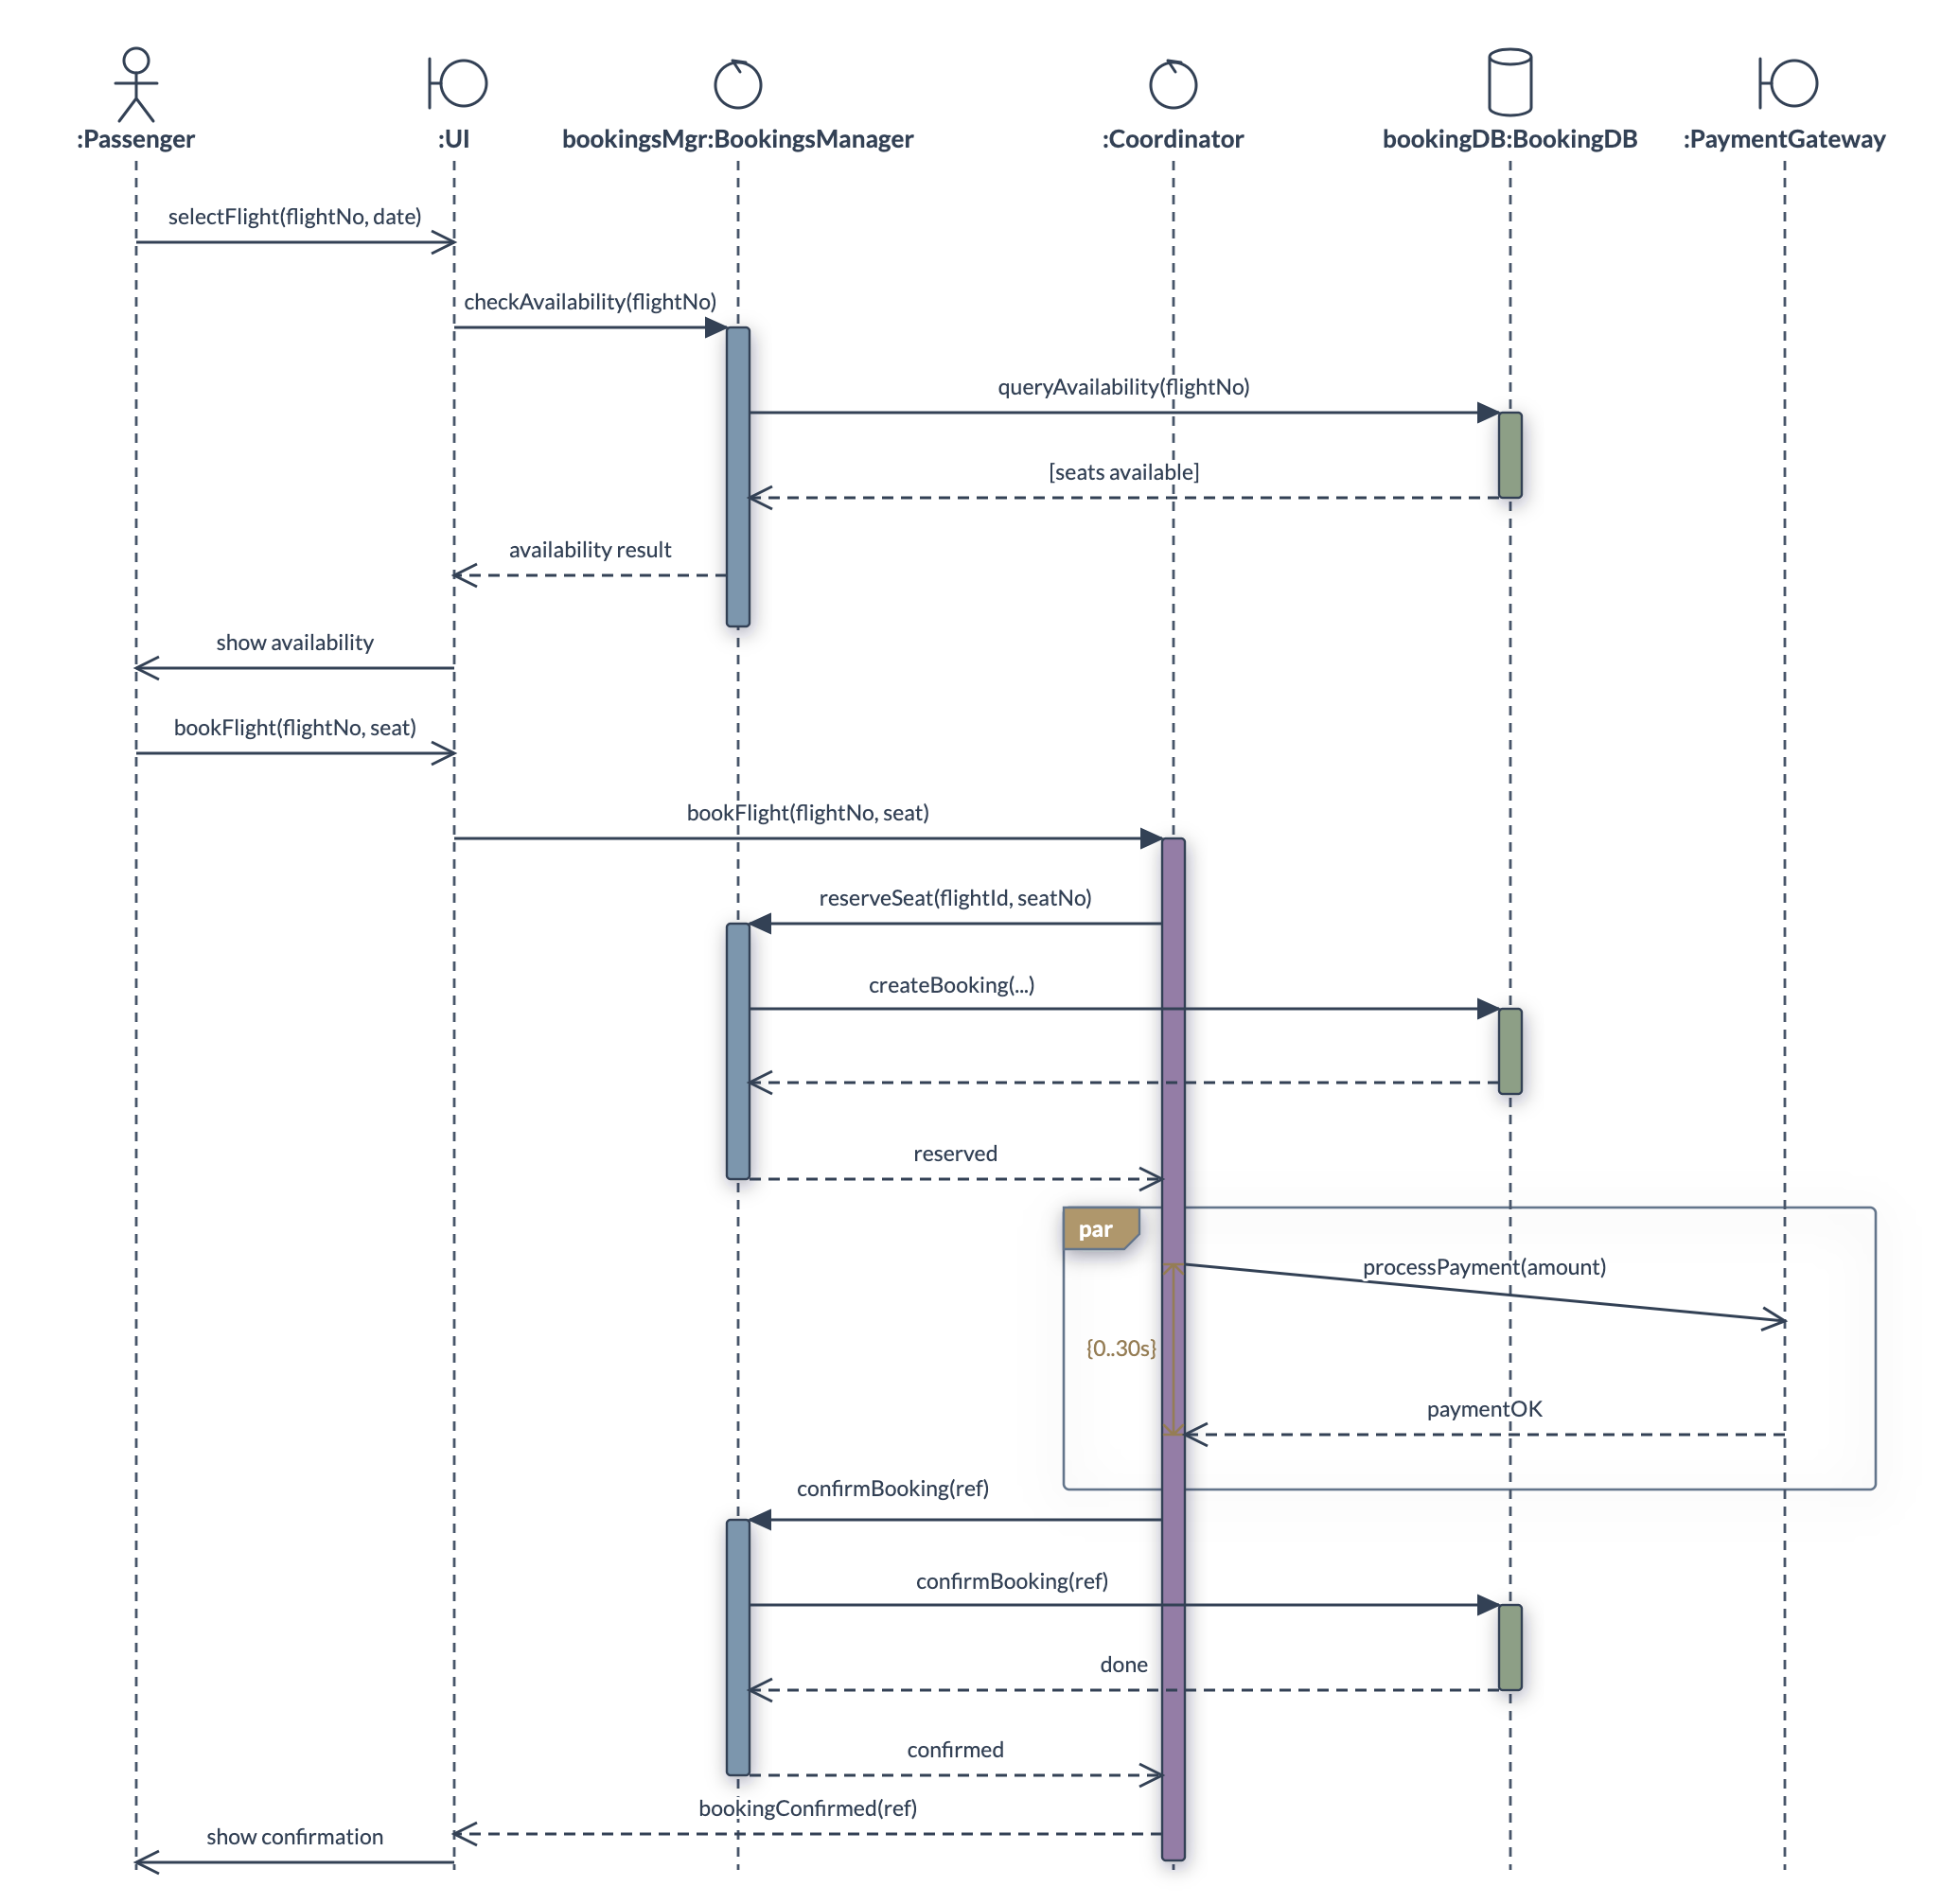
Sequence diagramOne scenario over time: lifelines, nested execution bars, synchronous and asynchronous
messages, fragments and timing constraints. The go-to view for an interaction.
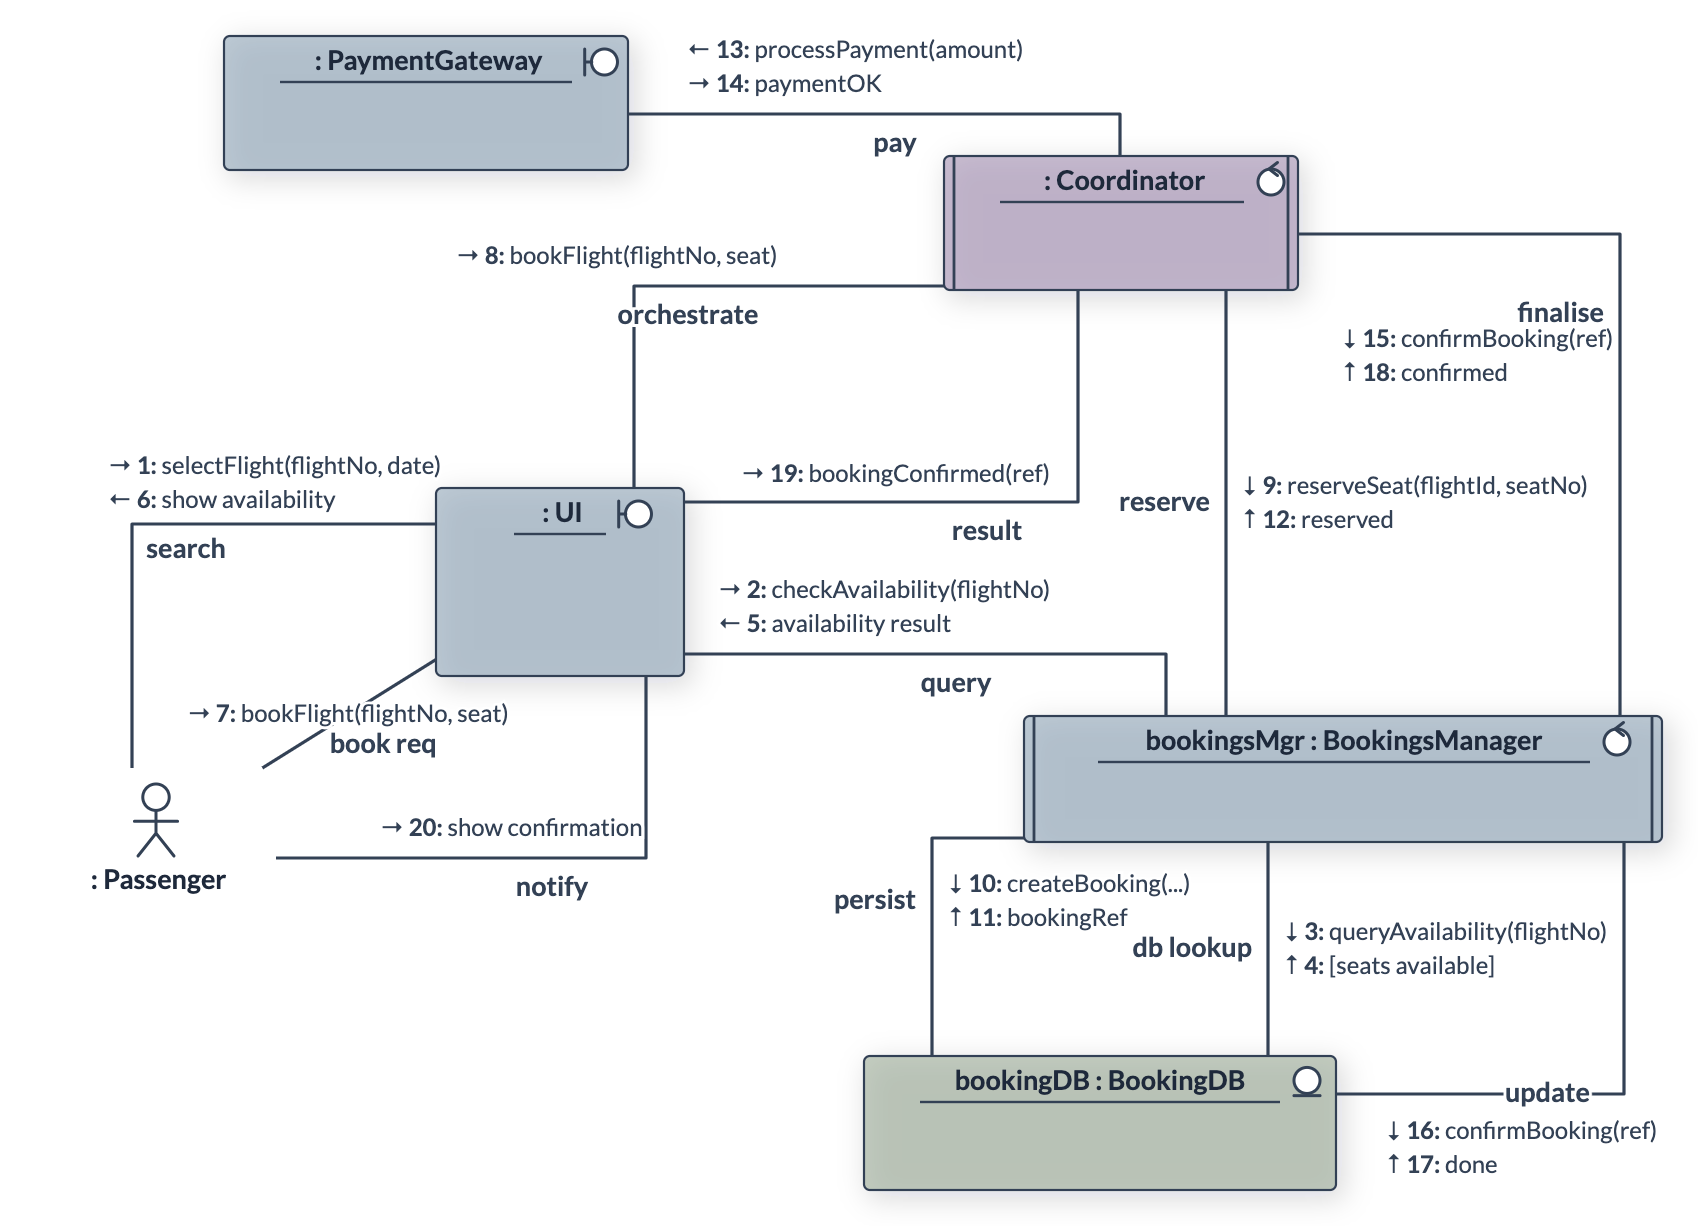
Communication diagramThe same interactions arranged by structure instead of time — numbered messages ride
the links, so the layout is free to mirror the architecture.
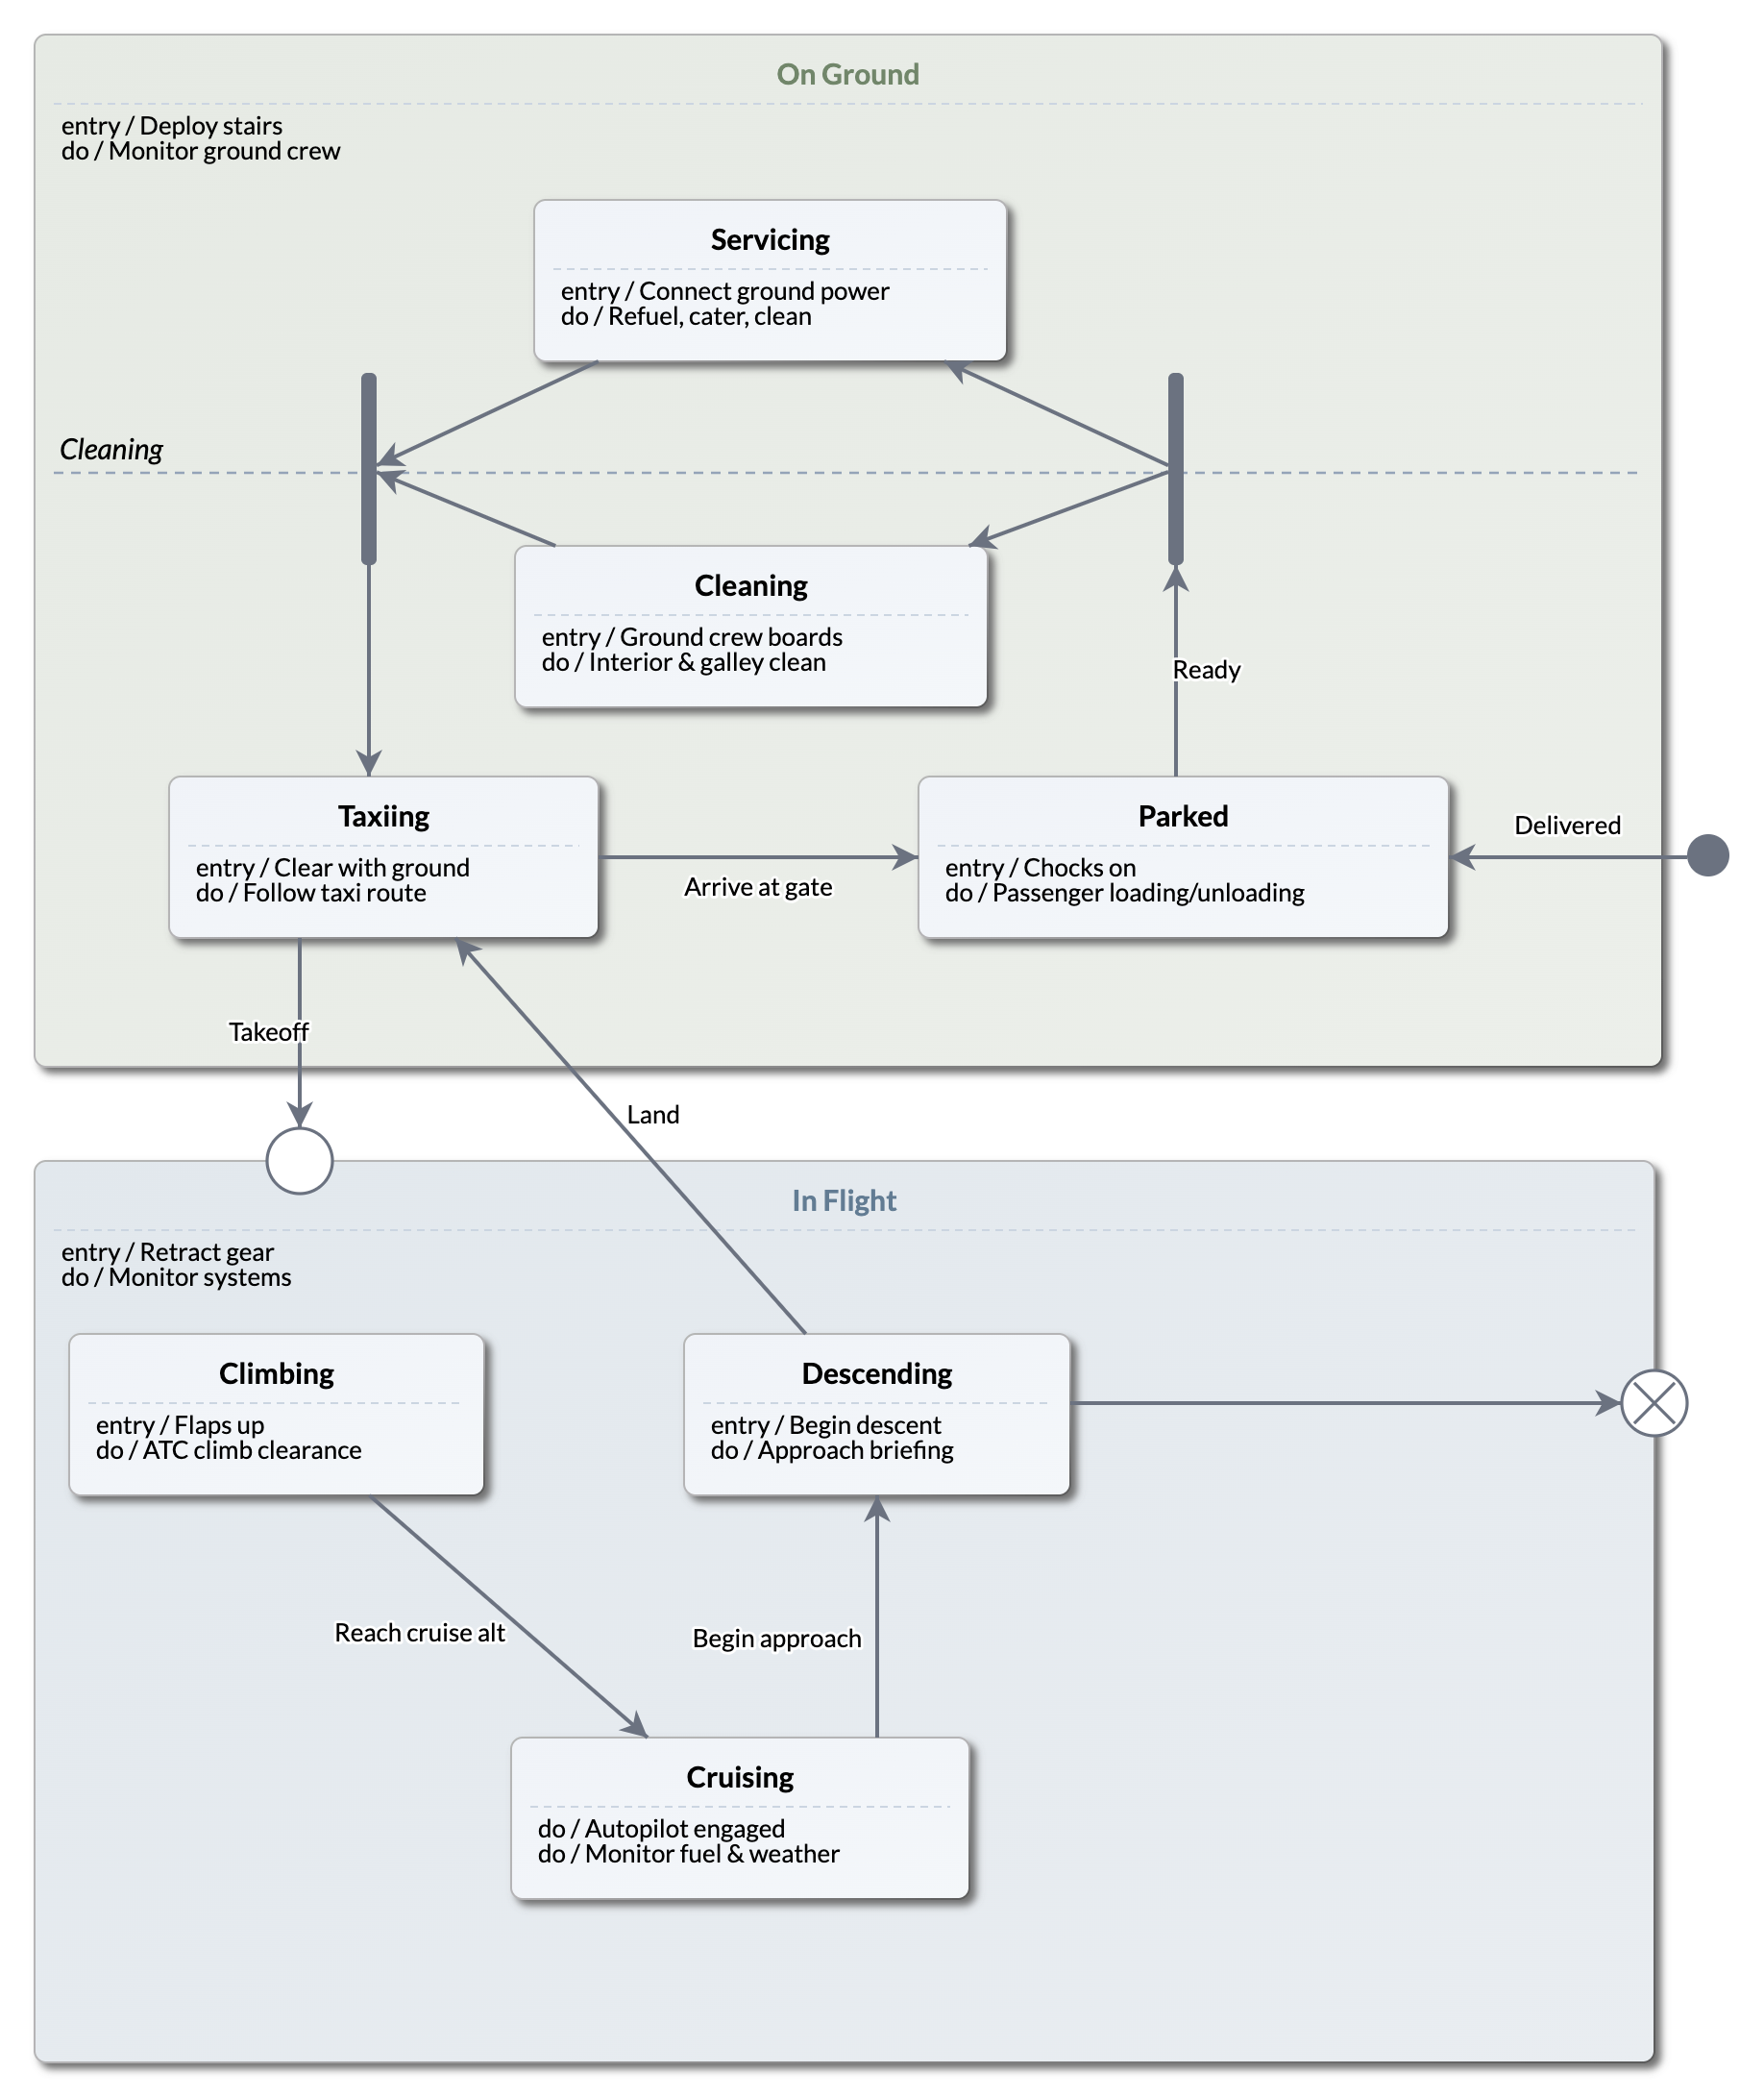
State machine diagramThe lifecycle of one thing: nested composite states, entry and exit points, regions
and fork/join — precise enough to double as a specification.
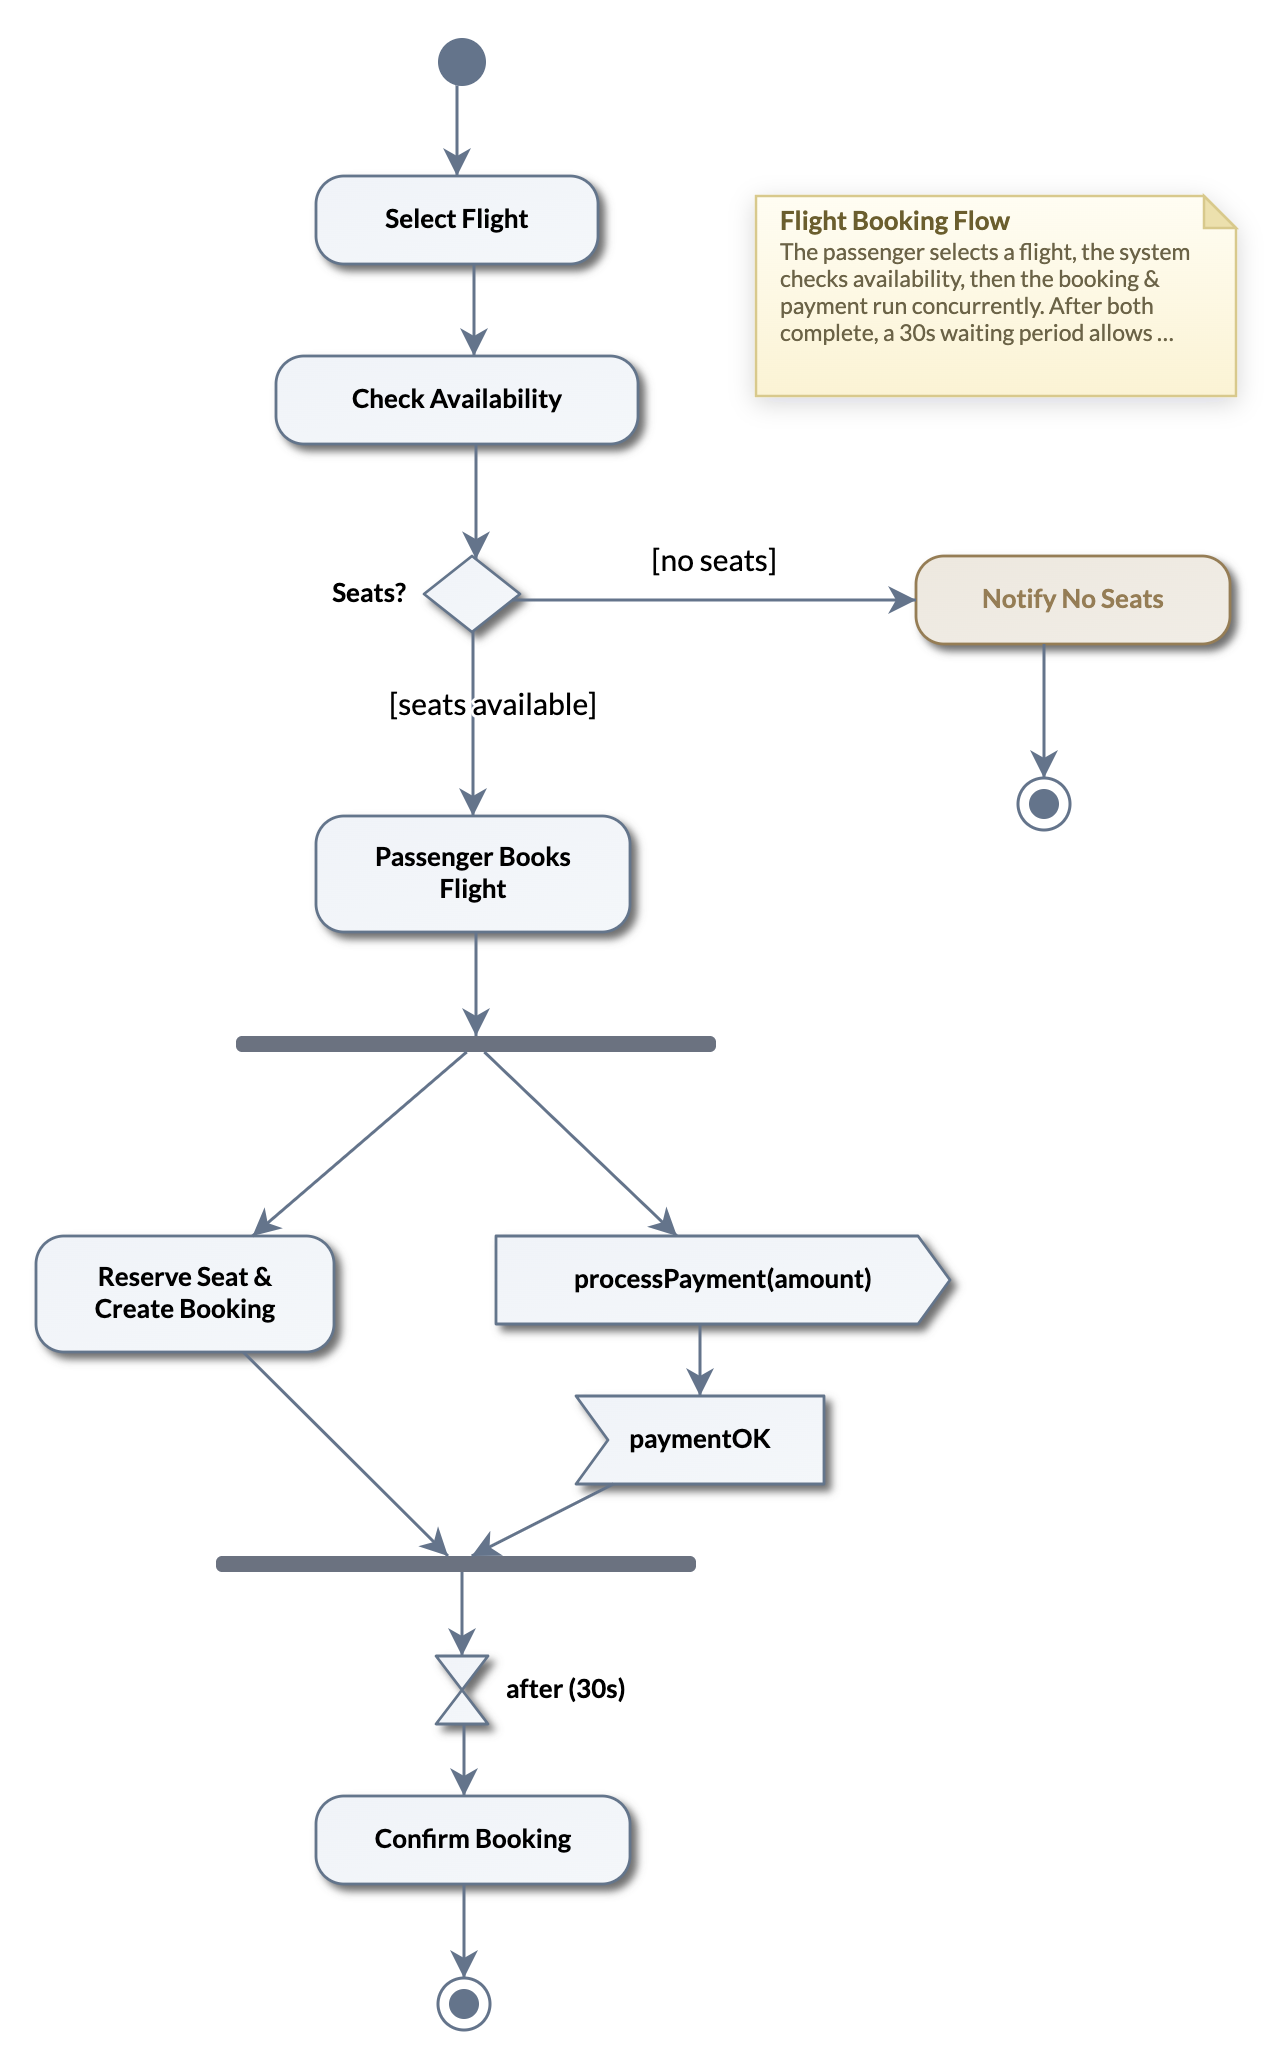
Activity diagramA flow of work with real concurrency — decisions, fork/join, signal send and receive,
and time events for the timeout paths people forget.
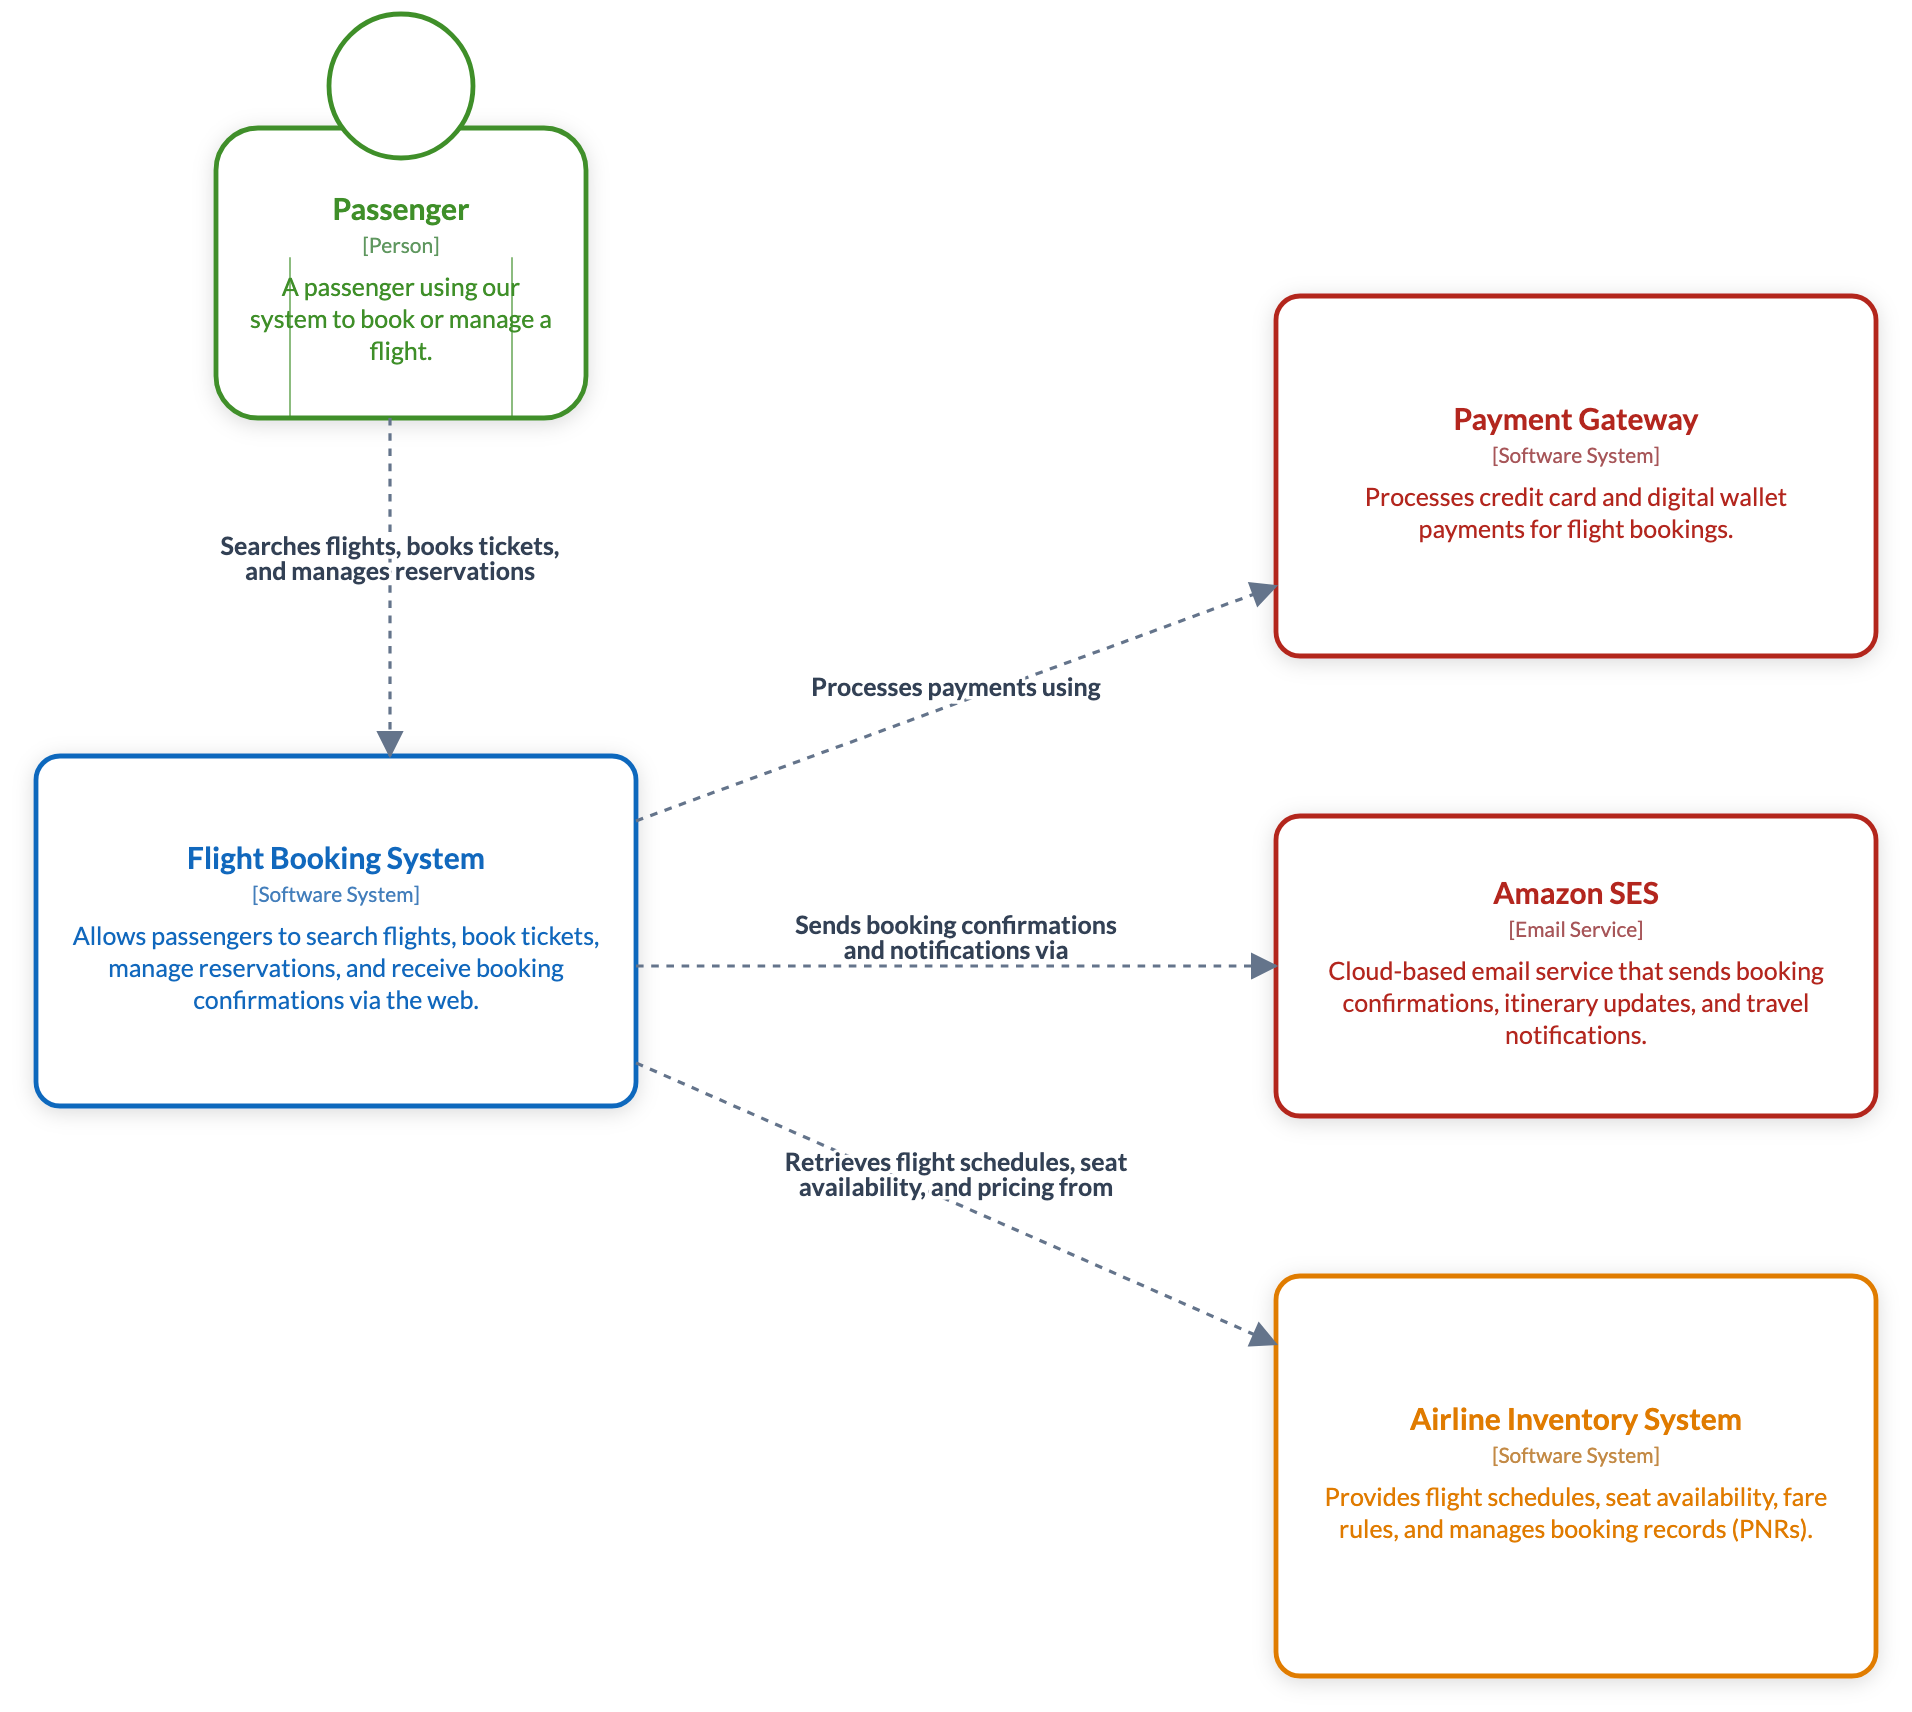
C4 — System ContextLevel 1 of Simon Brown's C4 model: the system among its users and neighbouring
systems, every relationship reading as a sentence. The diagram for stakeholders.
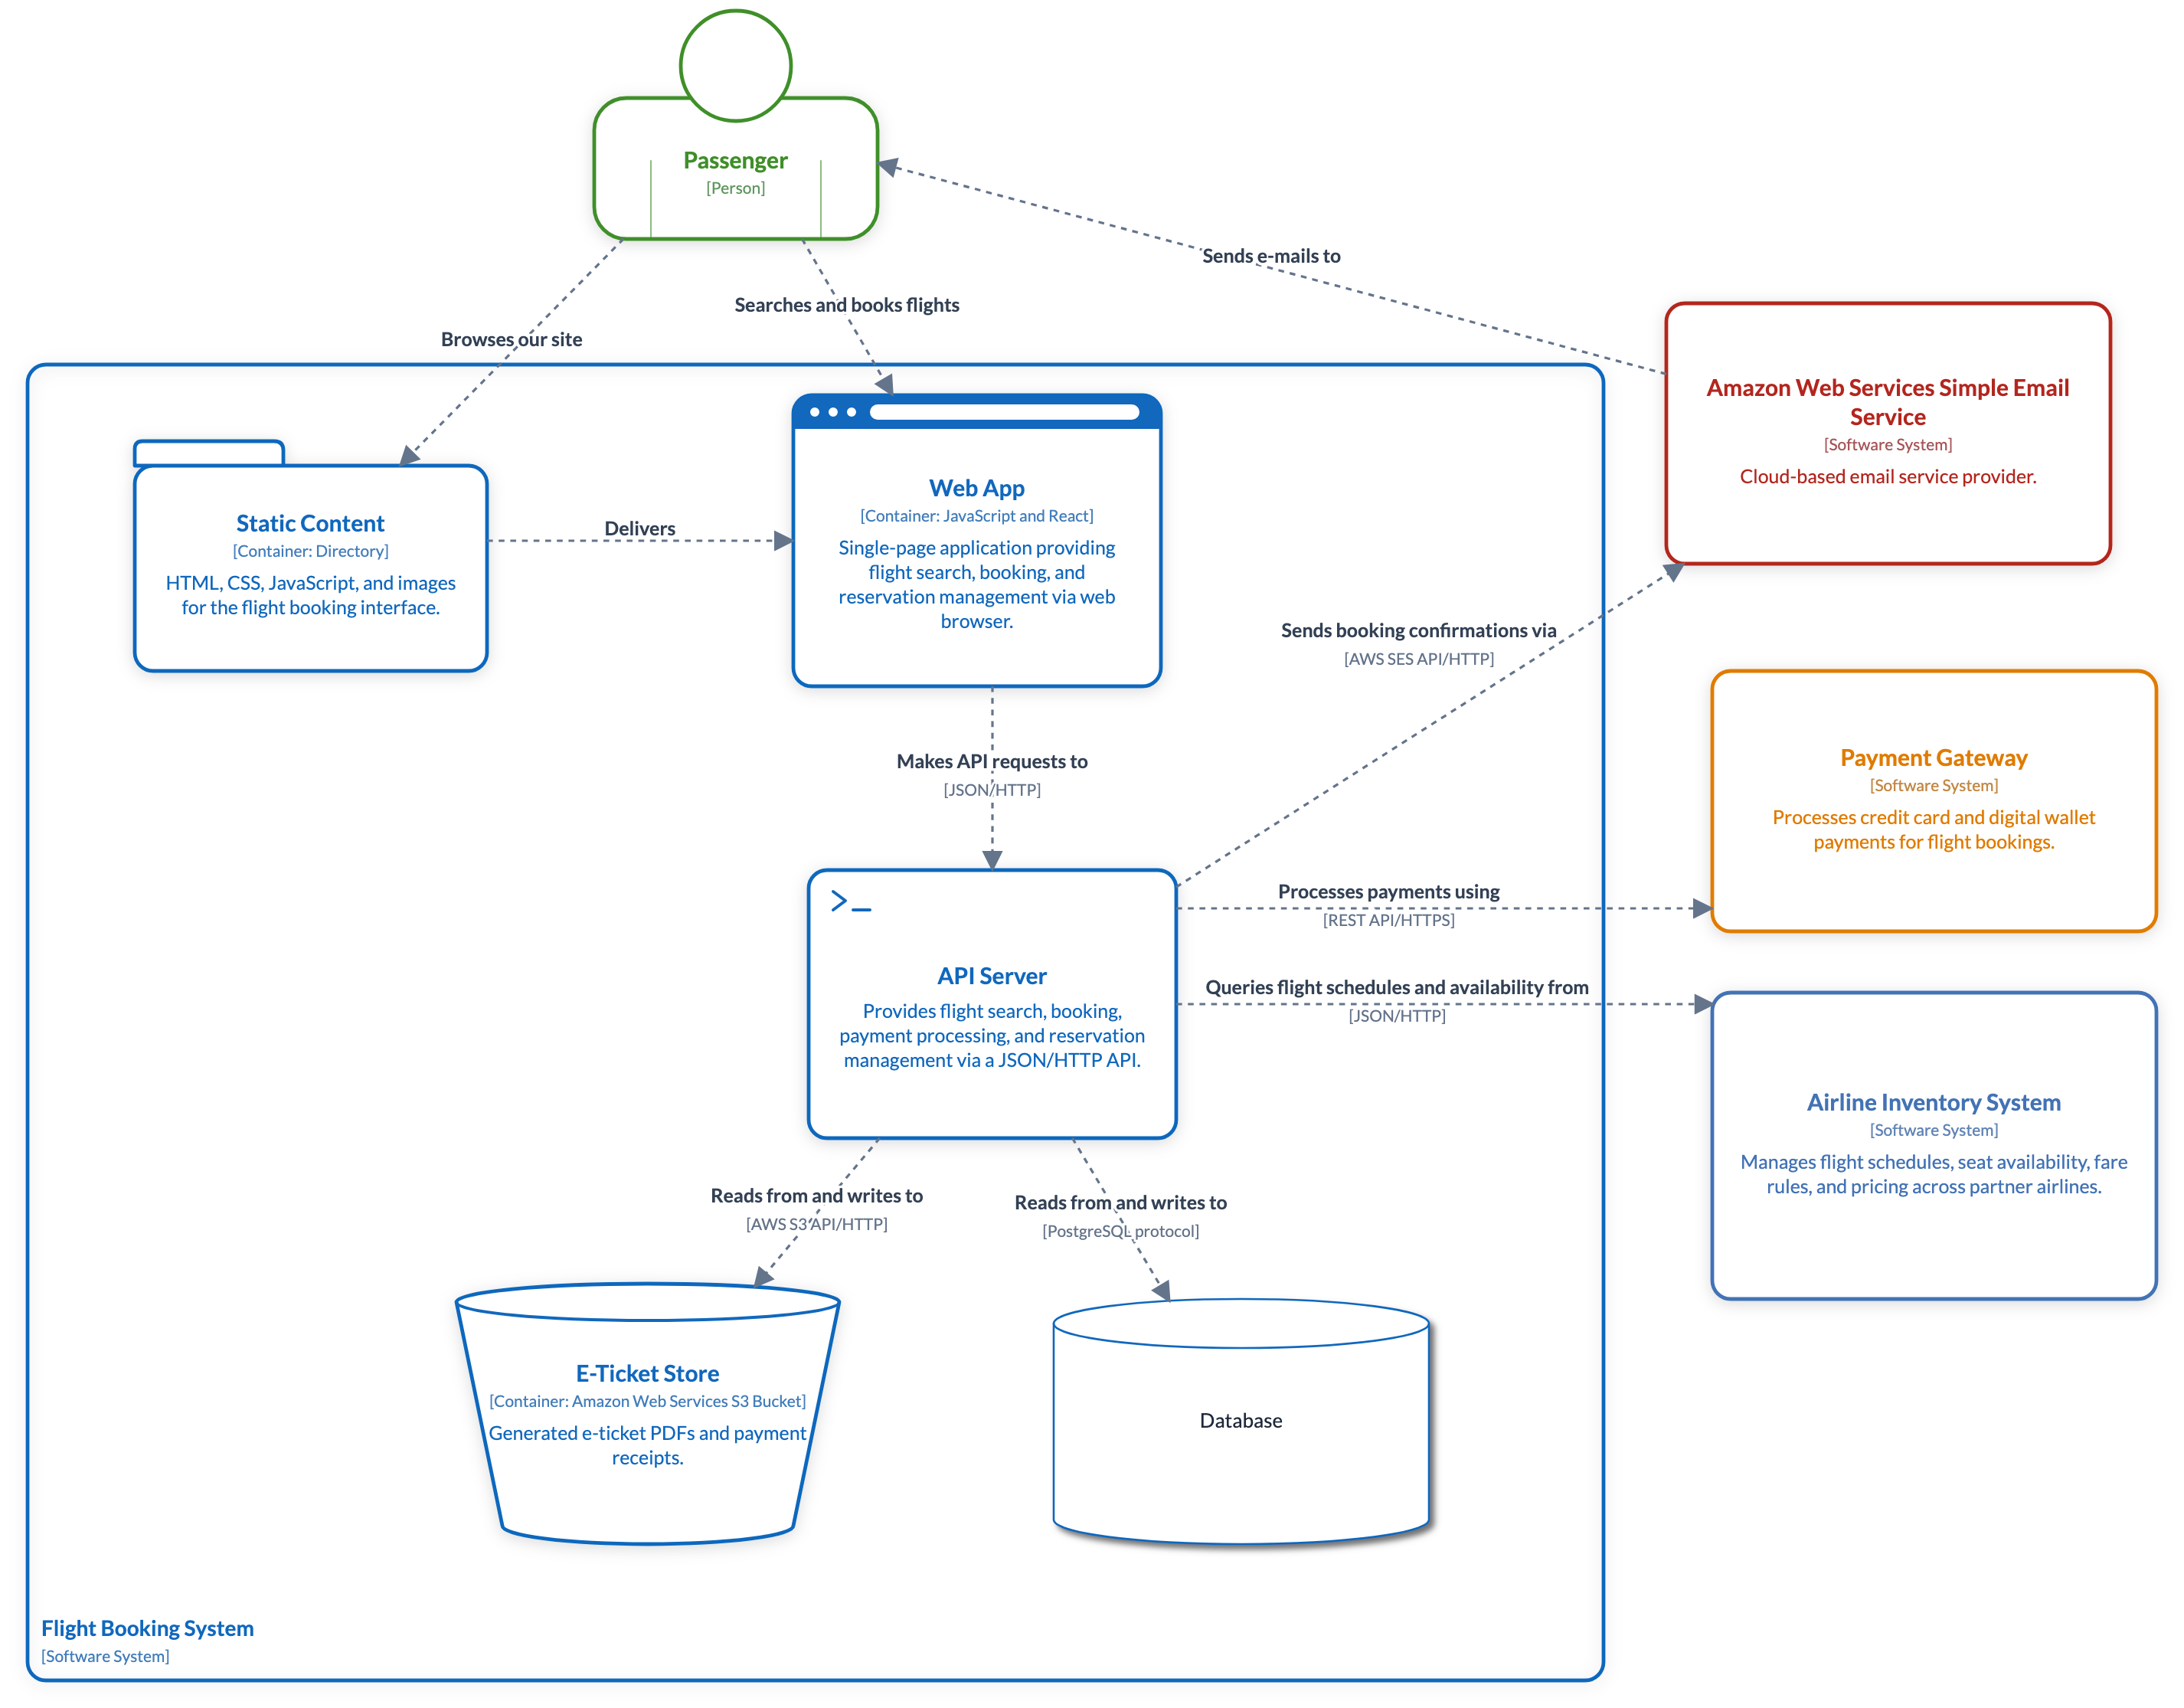
C4 — ContainerLevel 2: the deployable pieces — web apps, APIs, databases, stores — and how they
communicate. The architecture view for the delivery team.
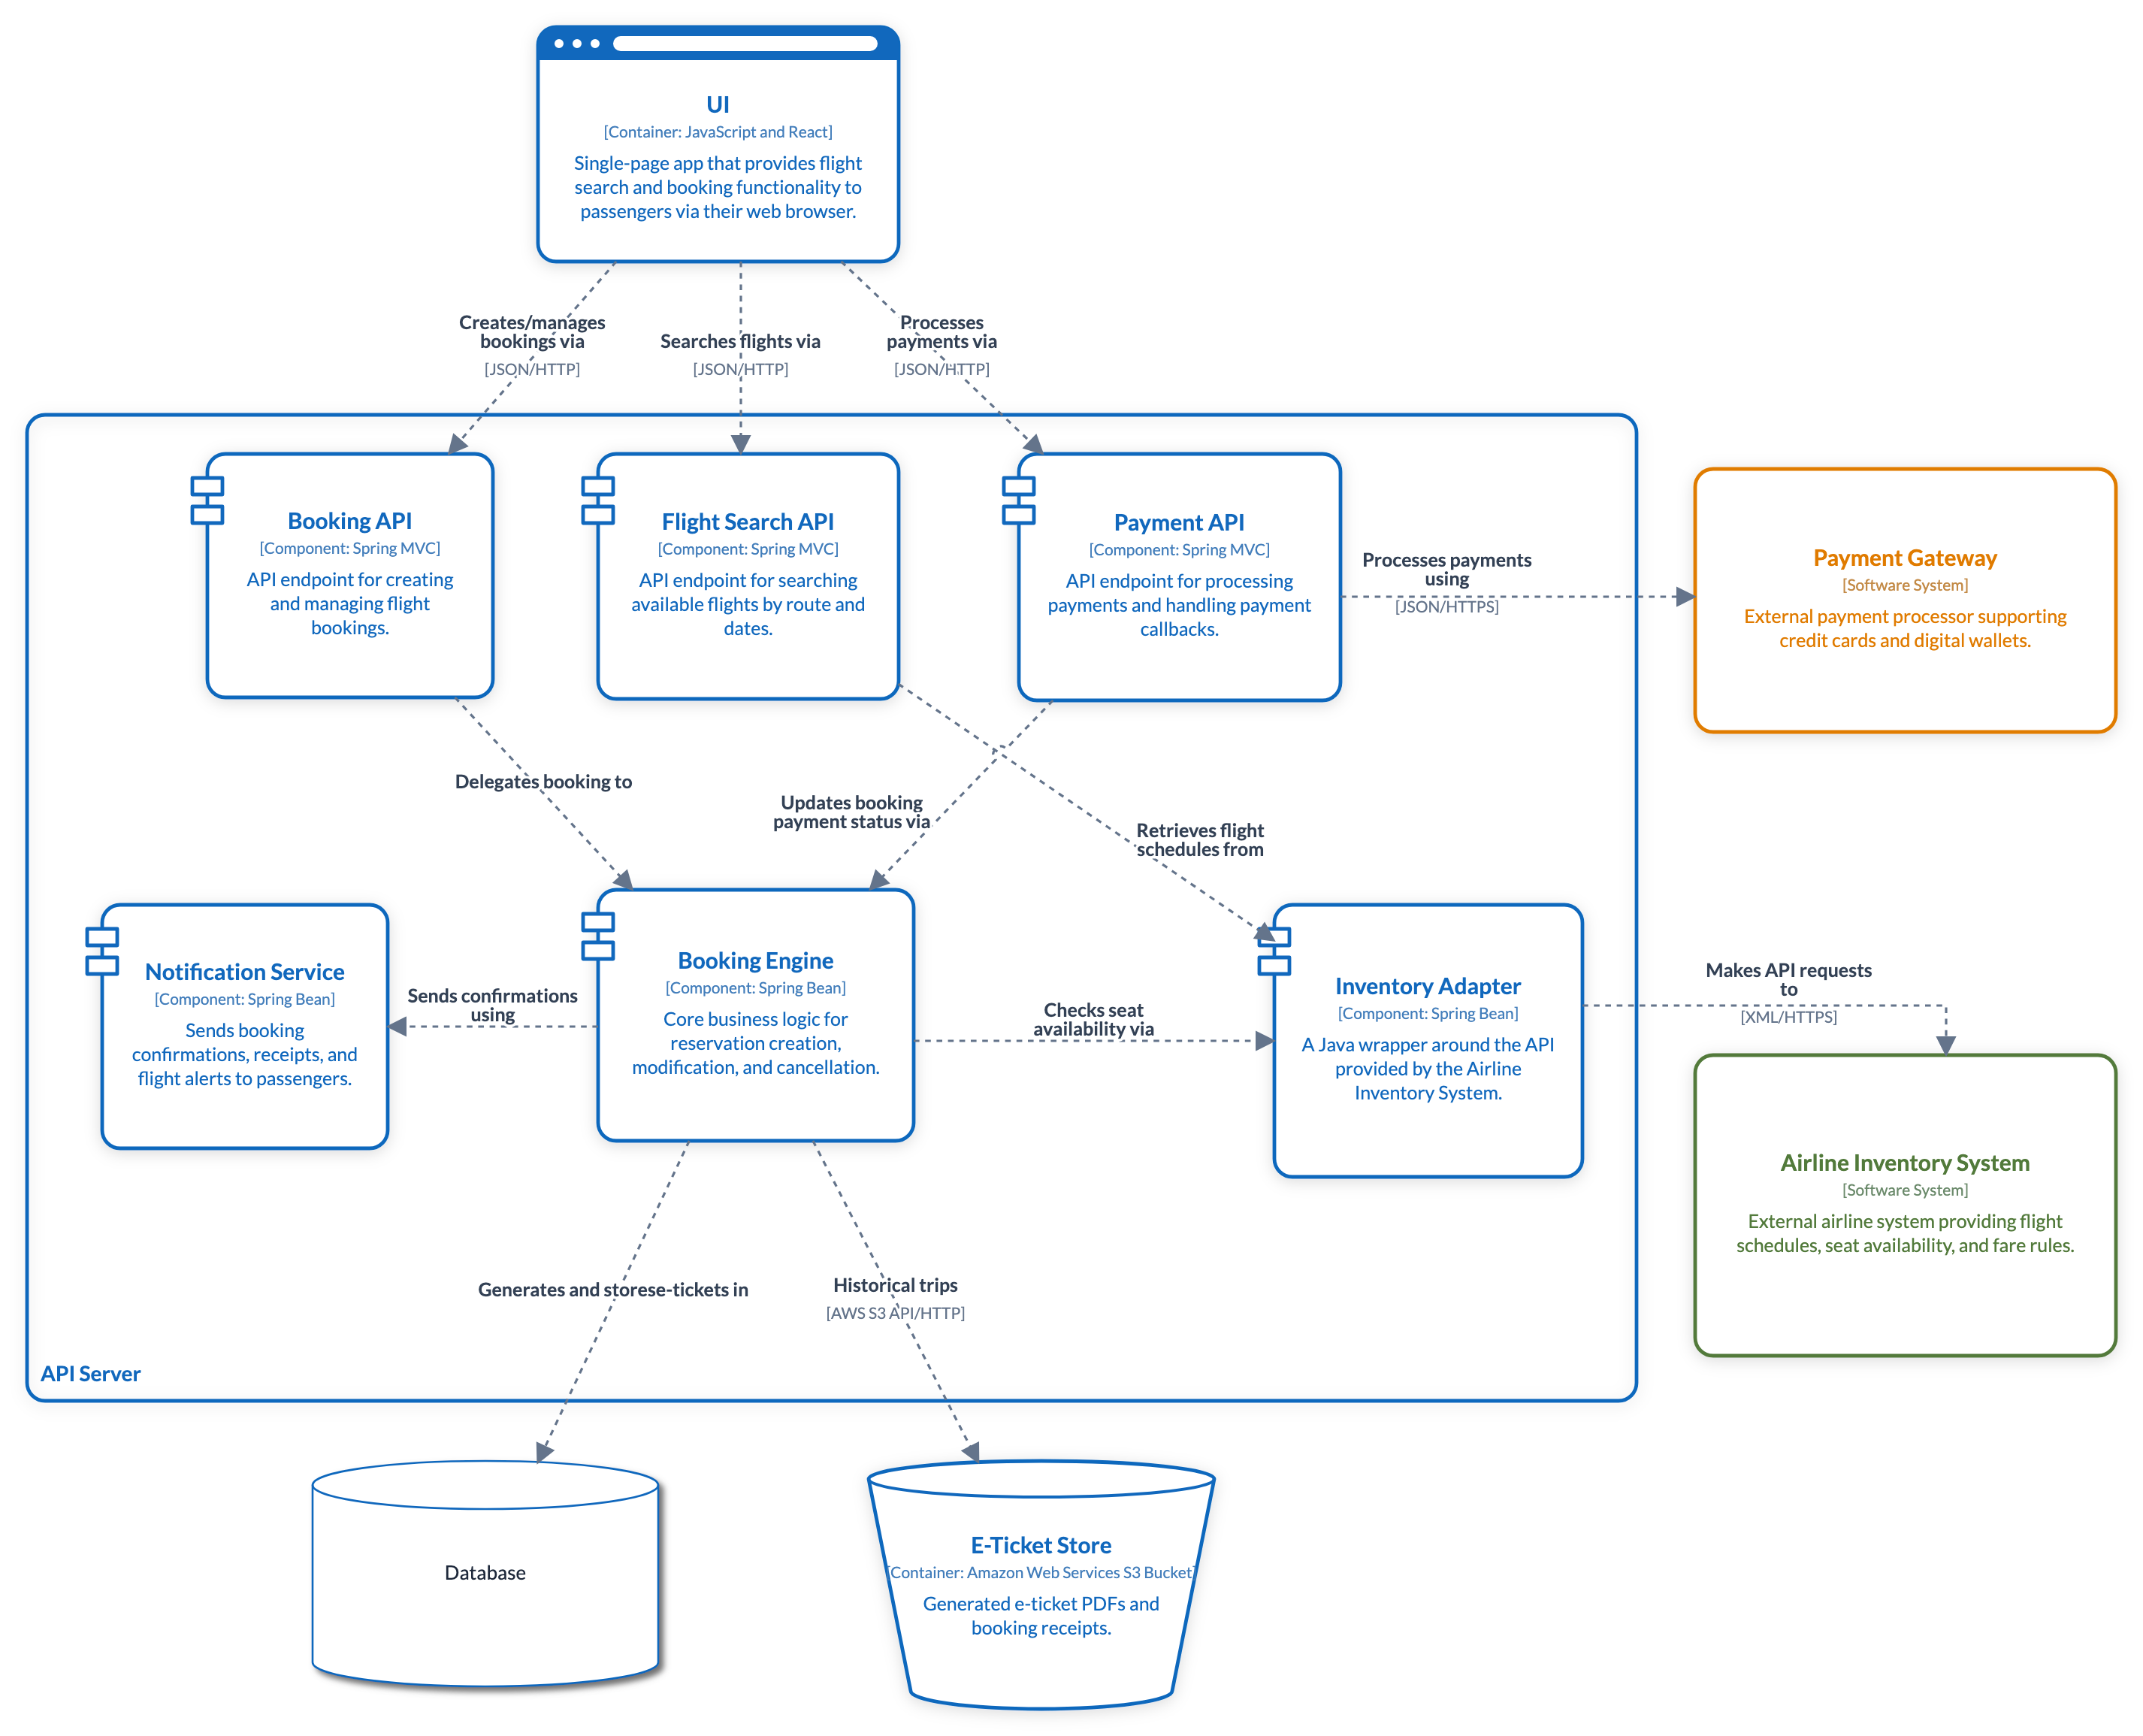
C4 — ComponentLevel 3: inside one container — its components and their responsibilities, wired to
each other and to the outside world.
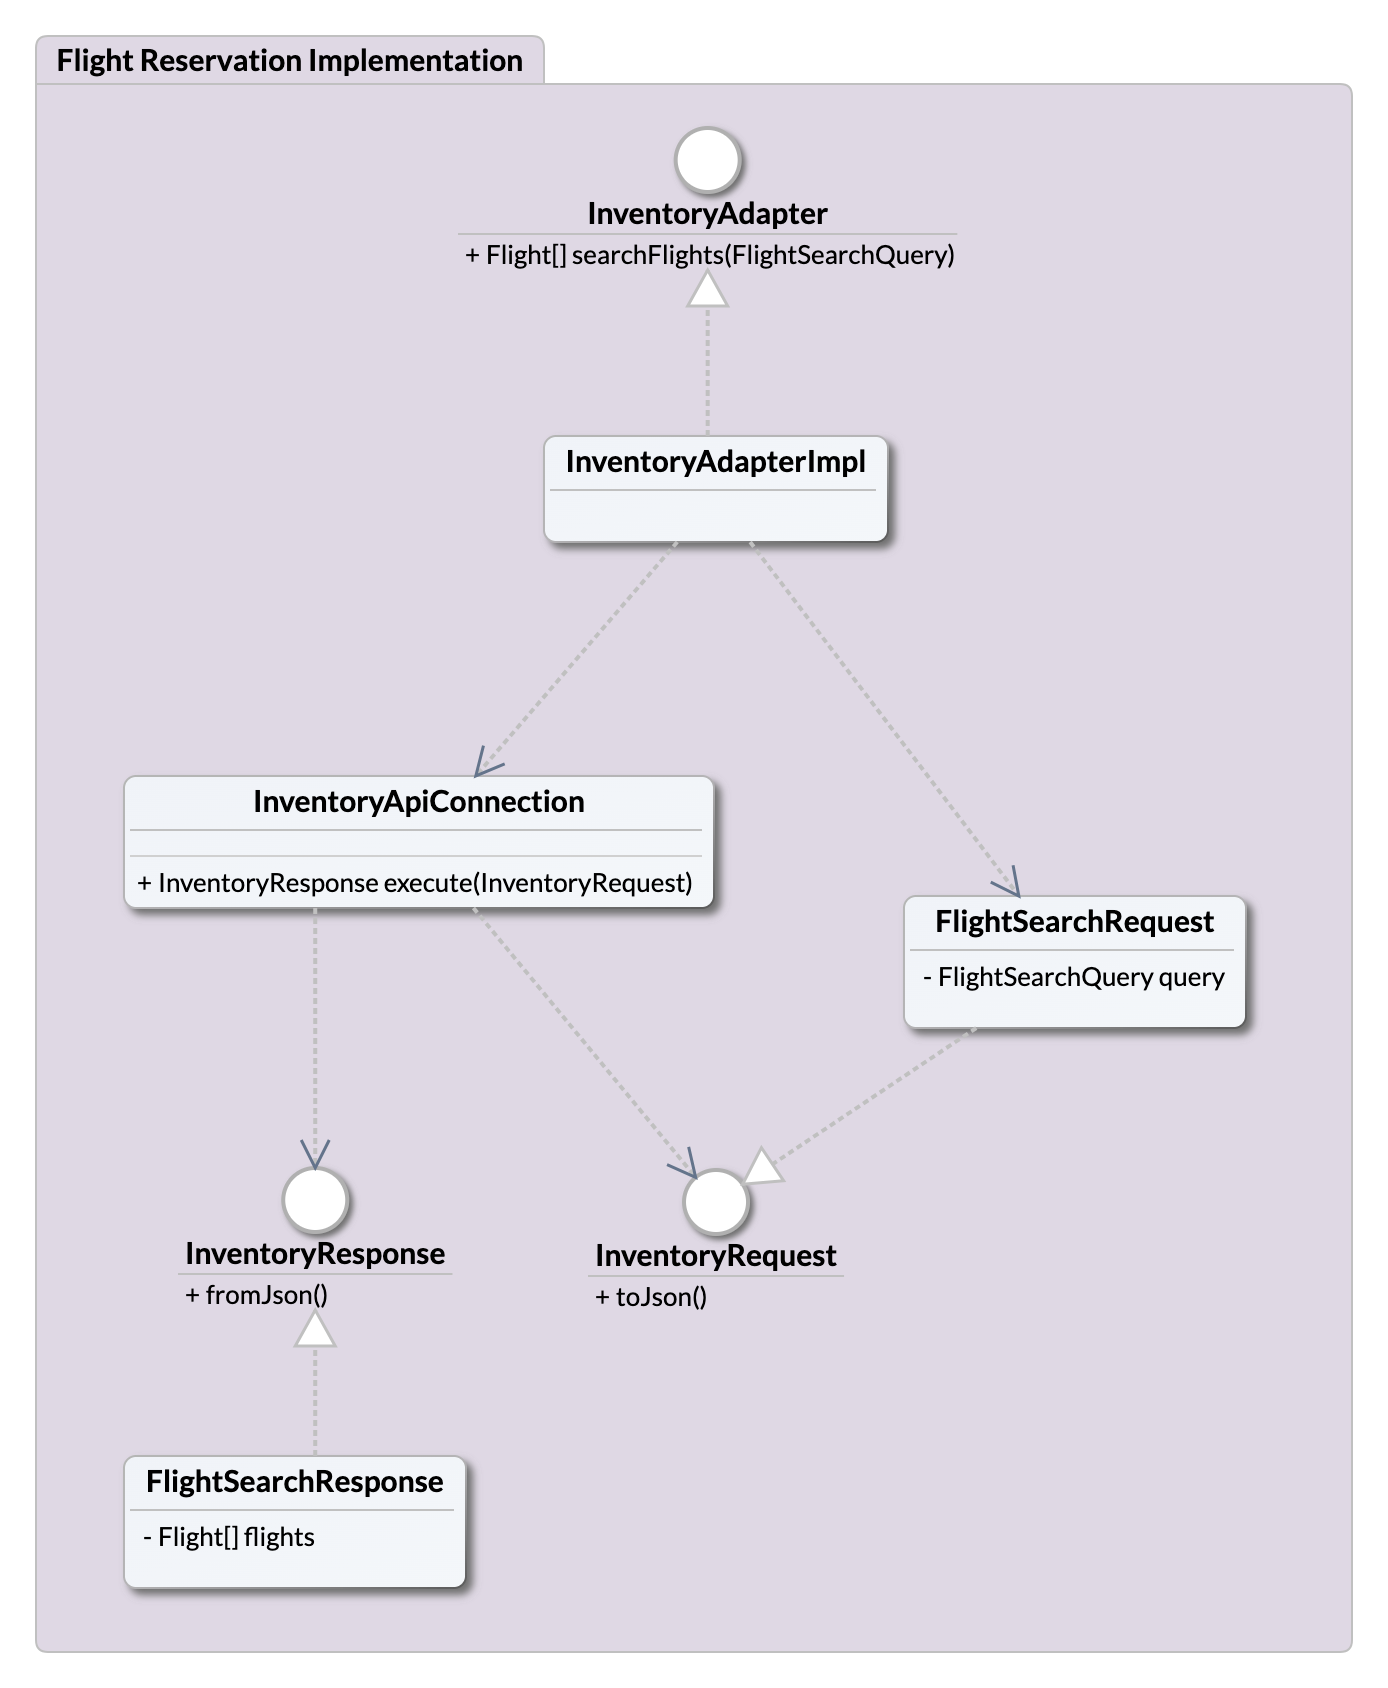
C4 — CodeLevel 4: the final zoom is plain UML — the classes inside one component, for the
people writing them.
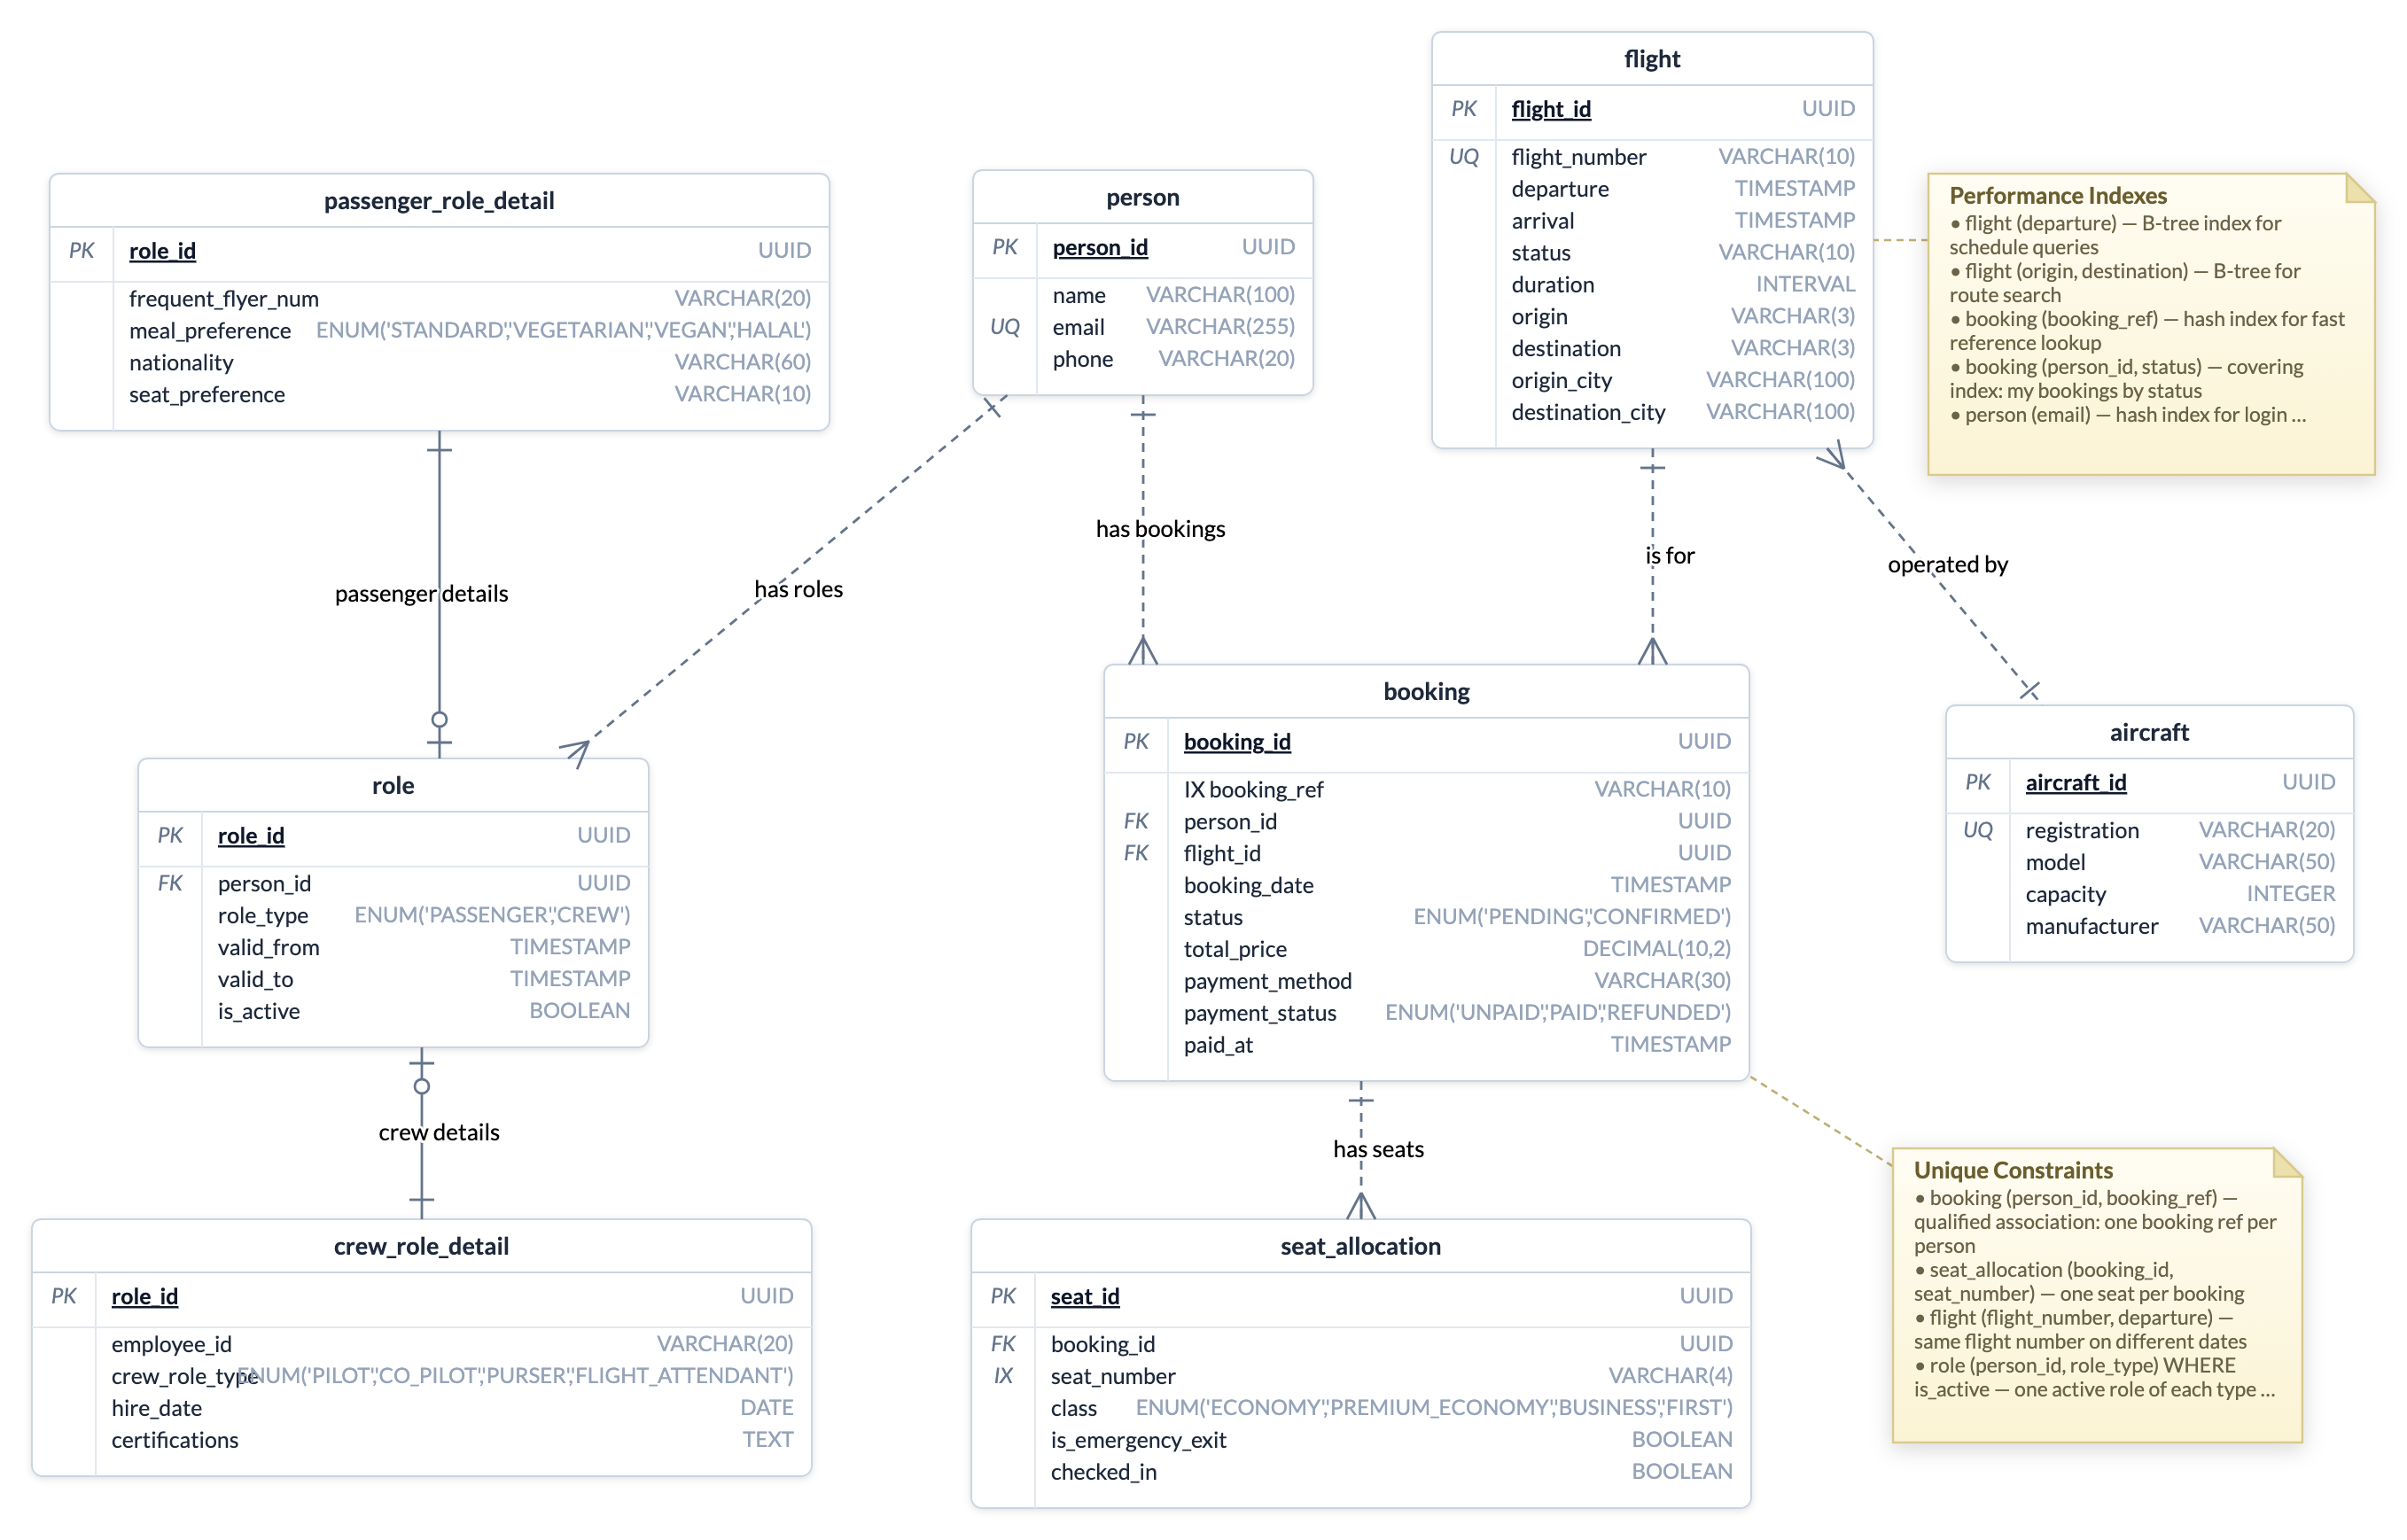
Database schemaTables with PK/FK/UQ/IX key markers and inline types, joined by crow's-foot
relationships — identifying or non-identifying — with notes carrying the physical design.
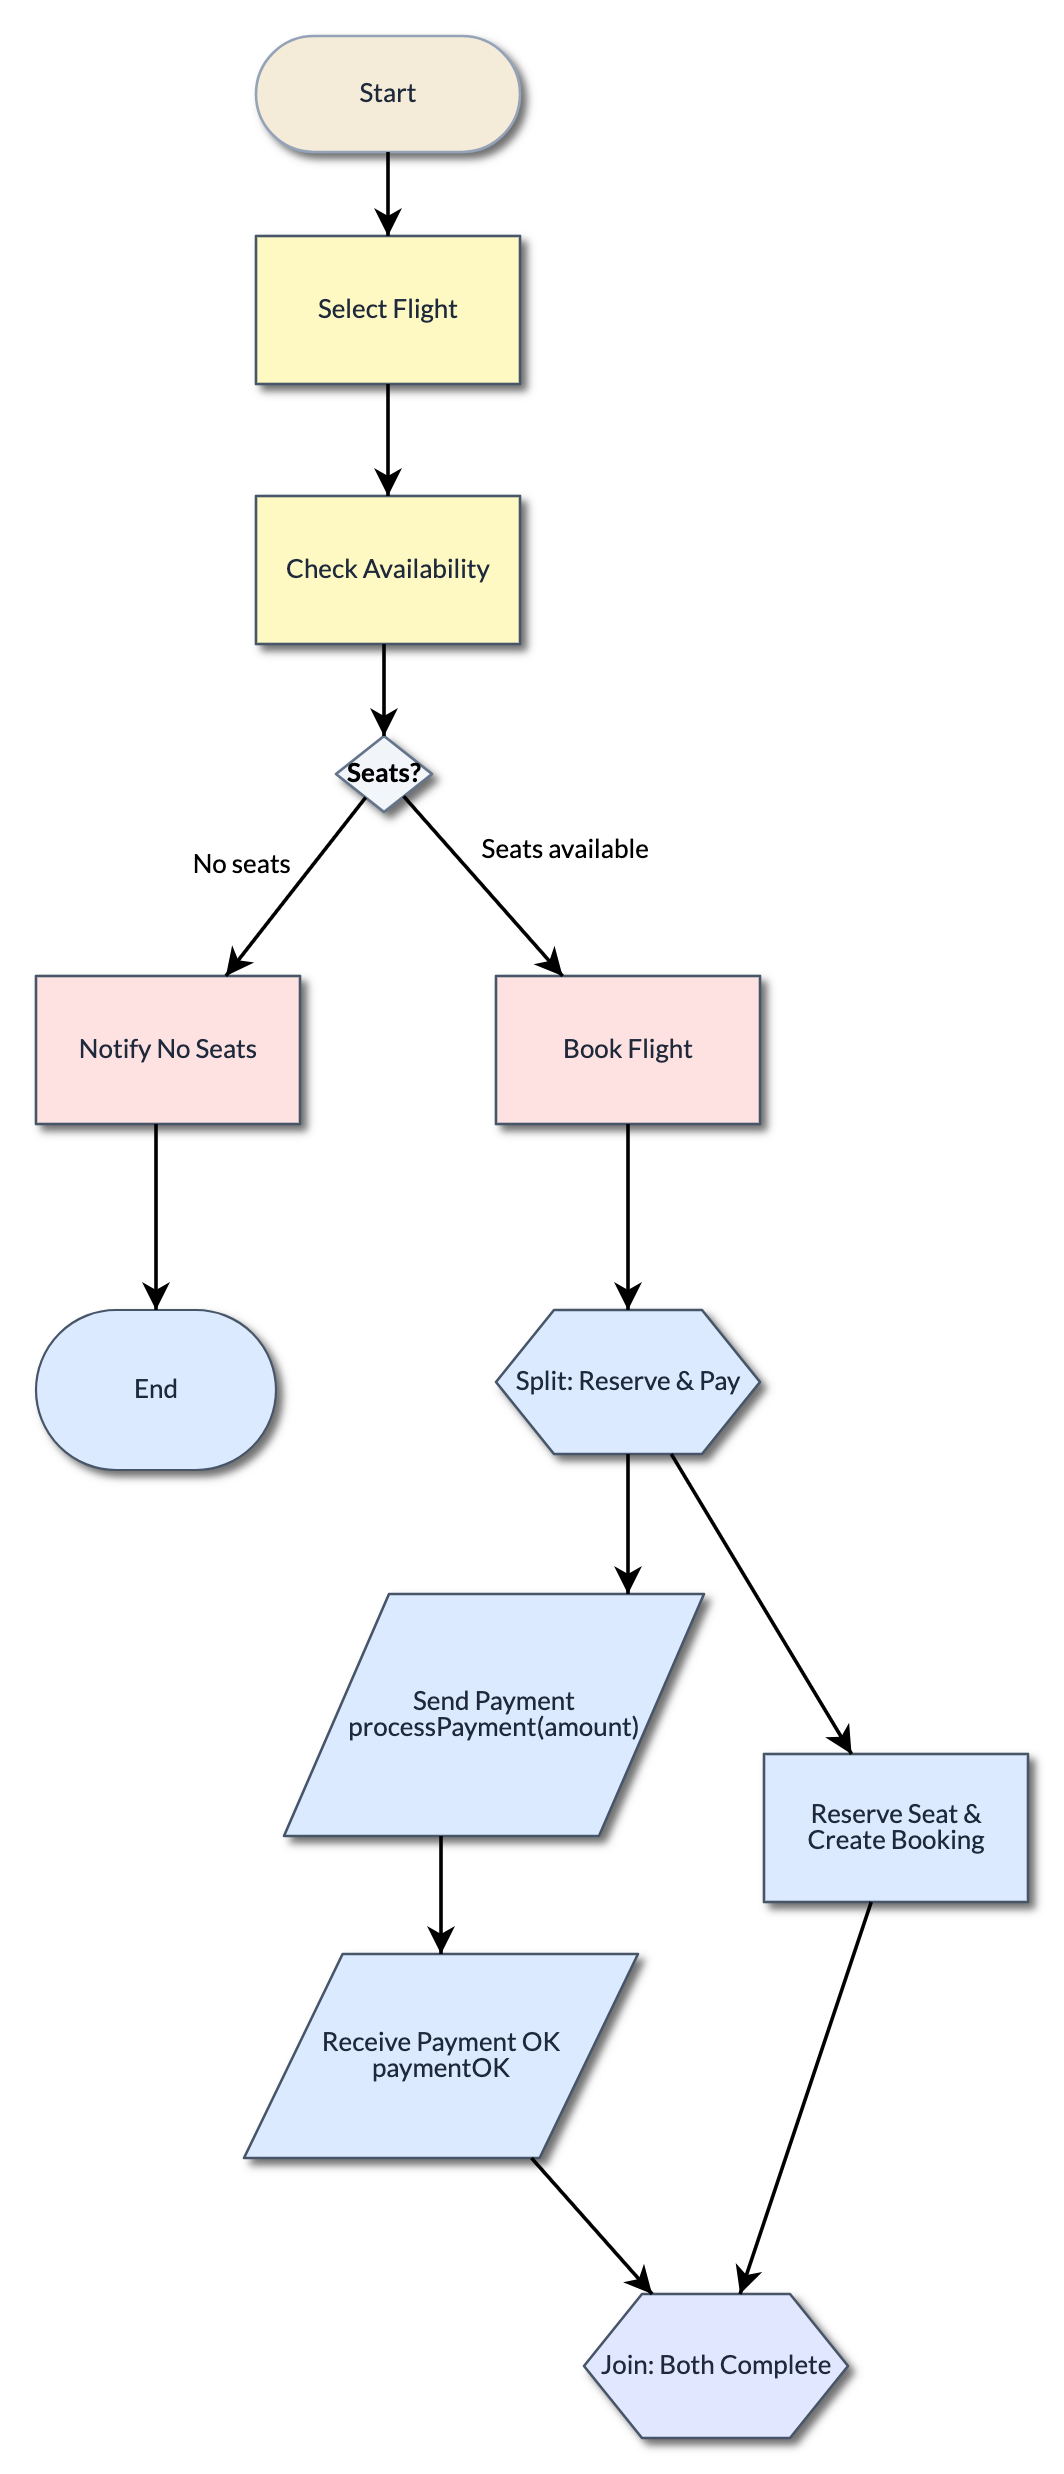
FlowchartThe classic notation for anything procedural — terminators, processes, decisions and
I/O, readable by absolutely everyone.
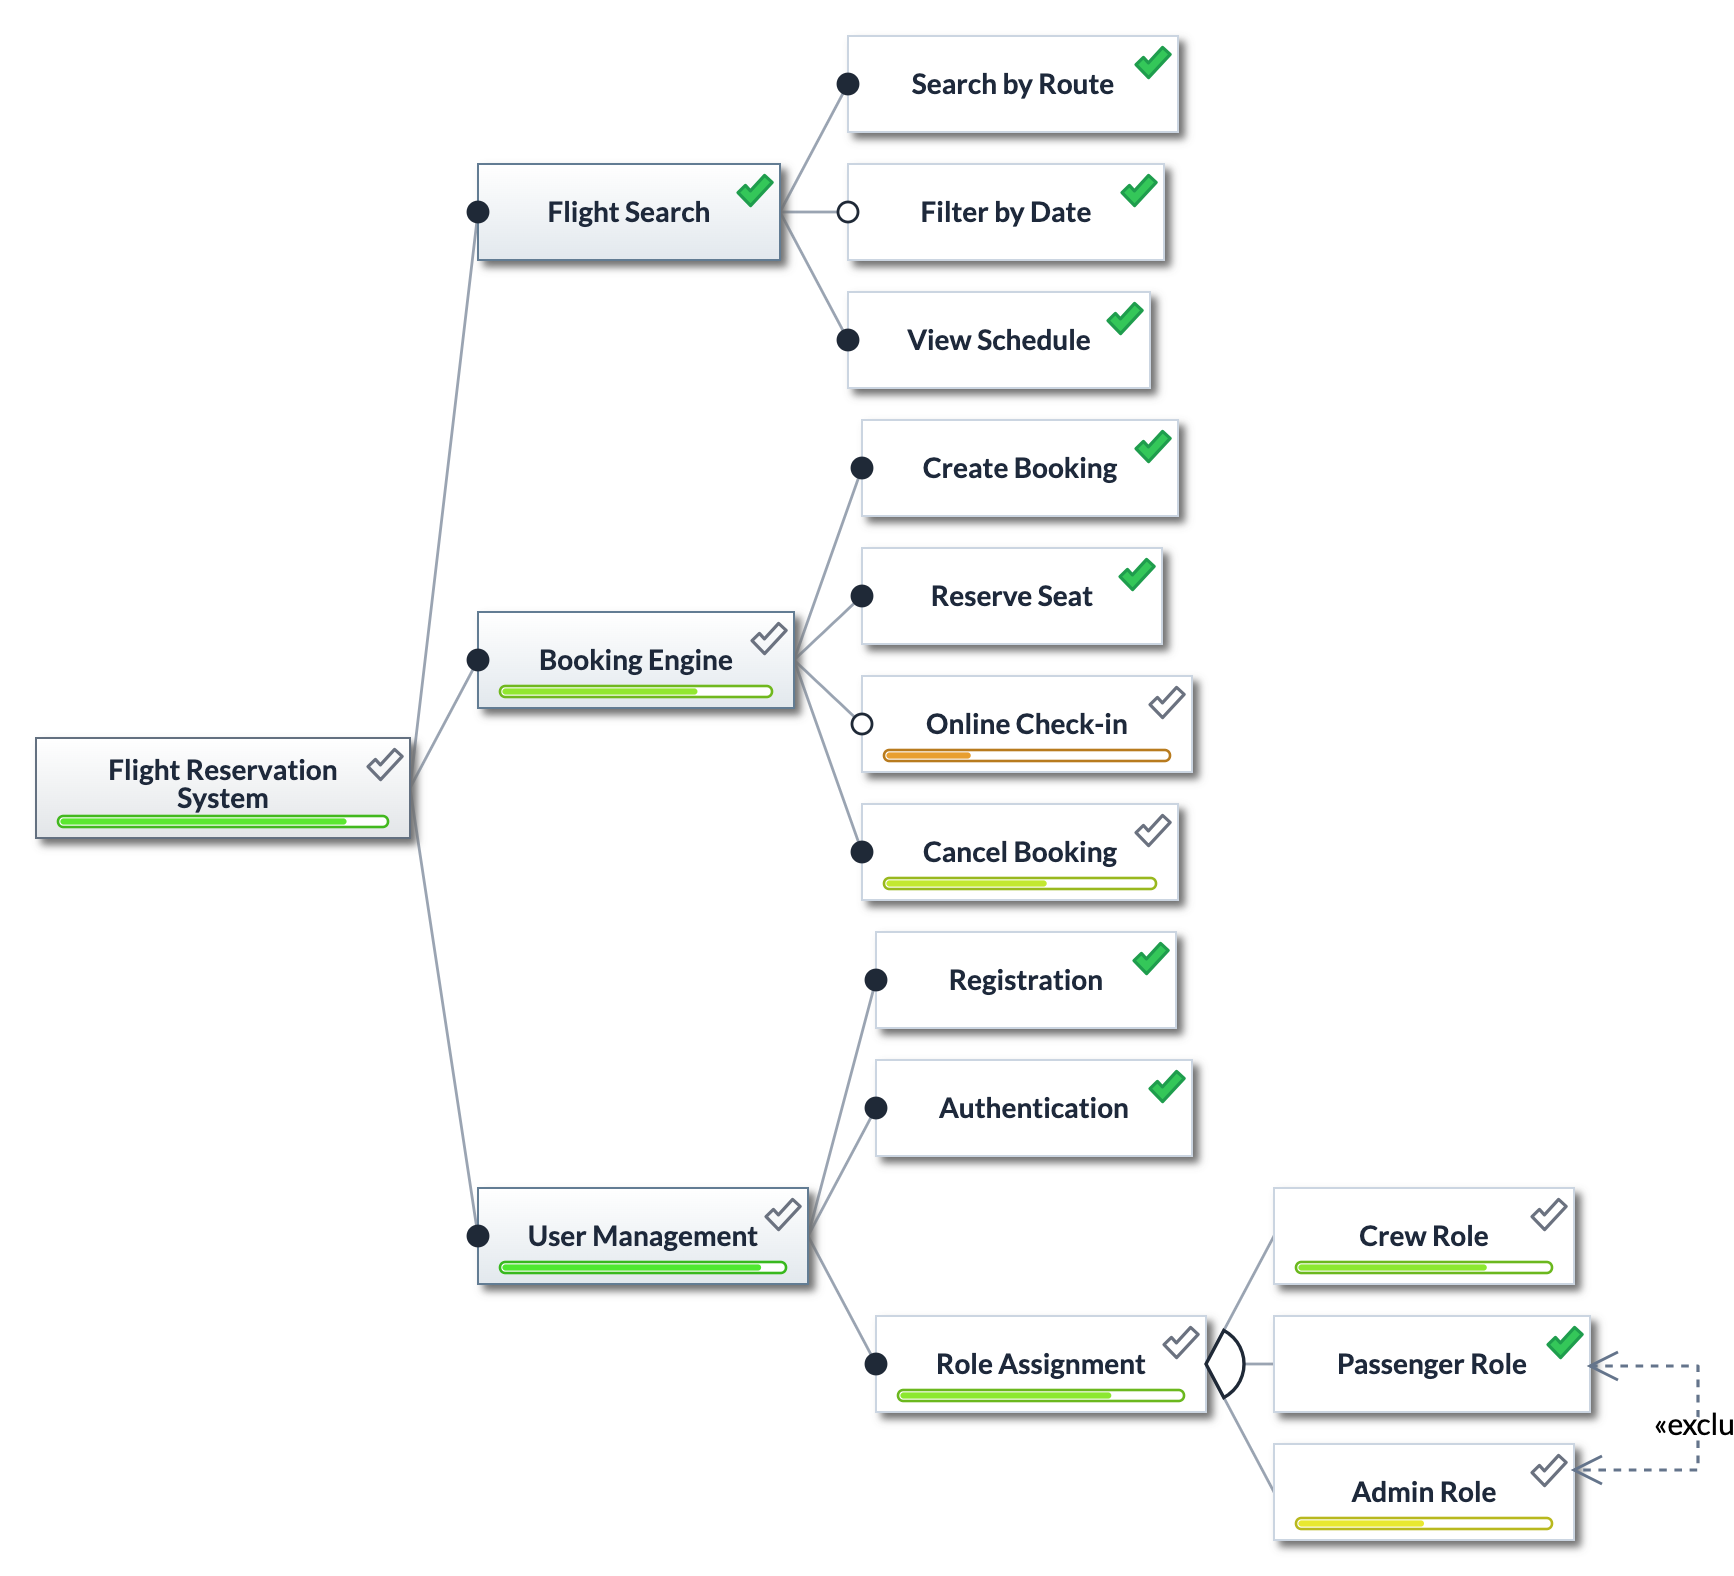
Feature diagramA product broken into a feature hierarchy, with progress badges and constraint links
(requires / excludes) — a model that doubles as a delivery map.
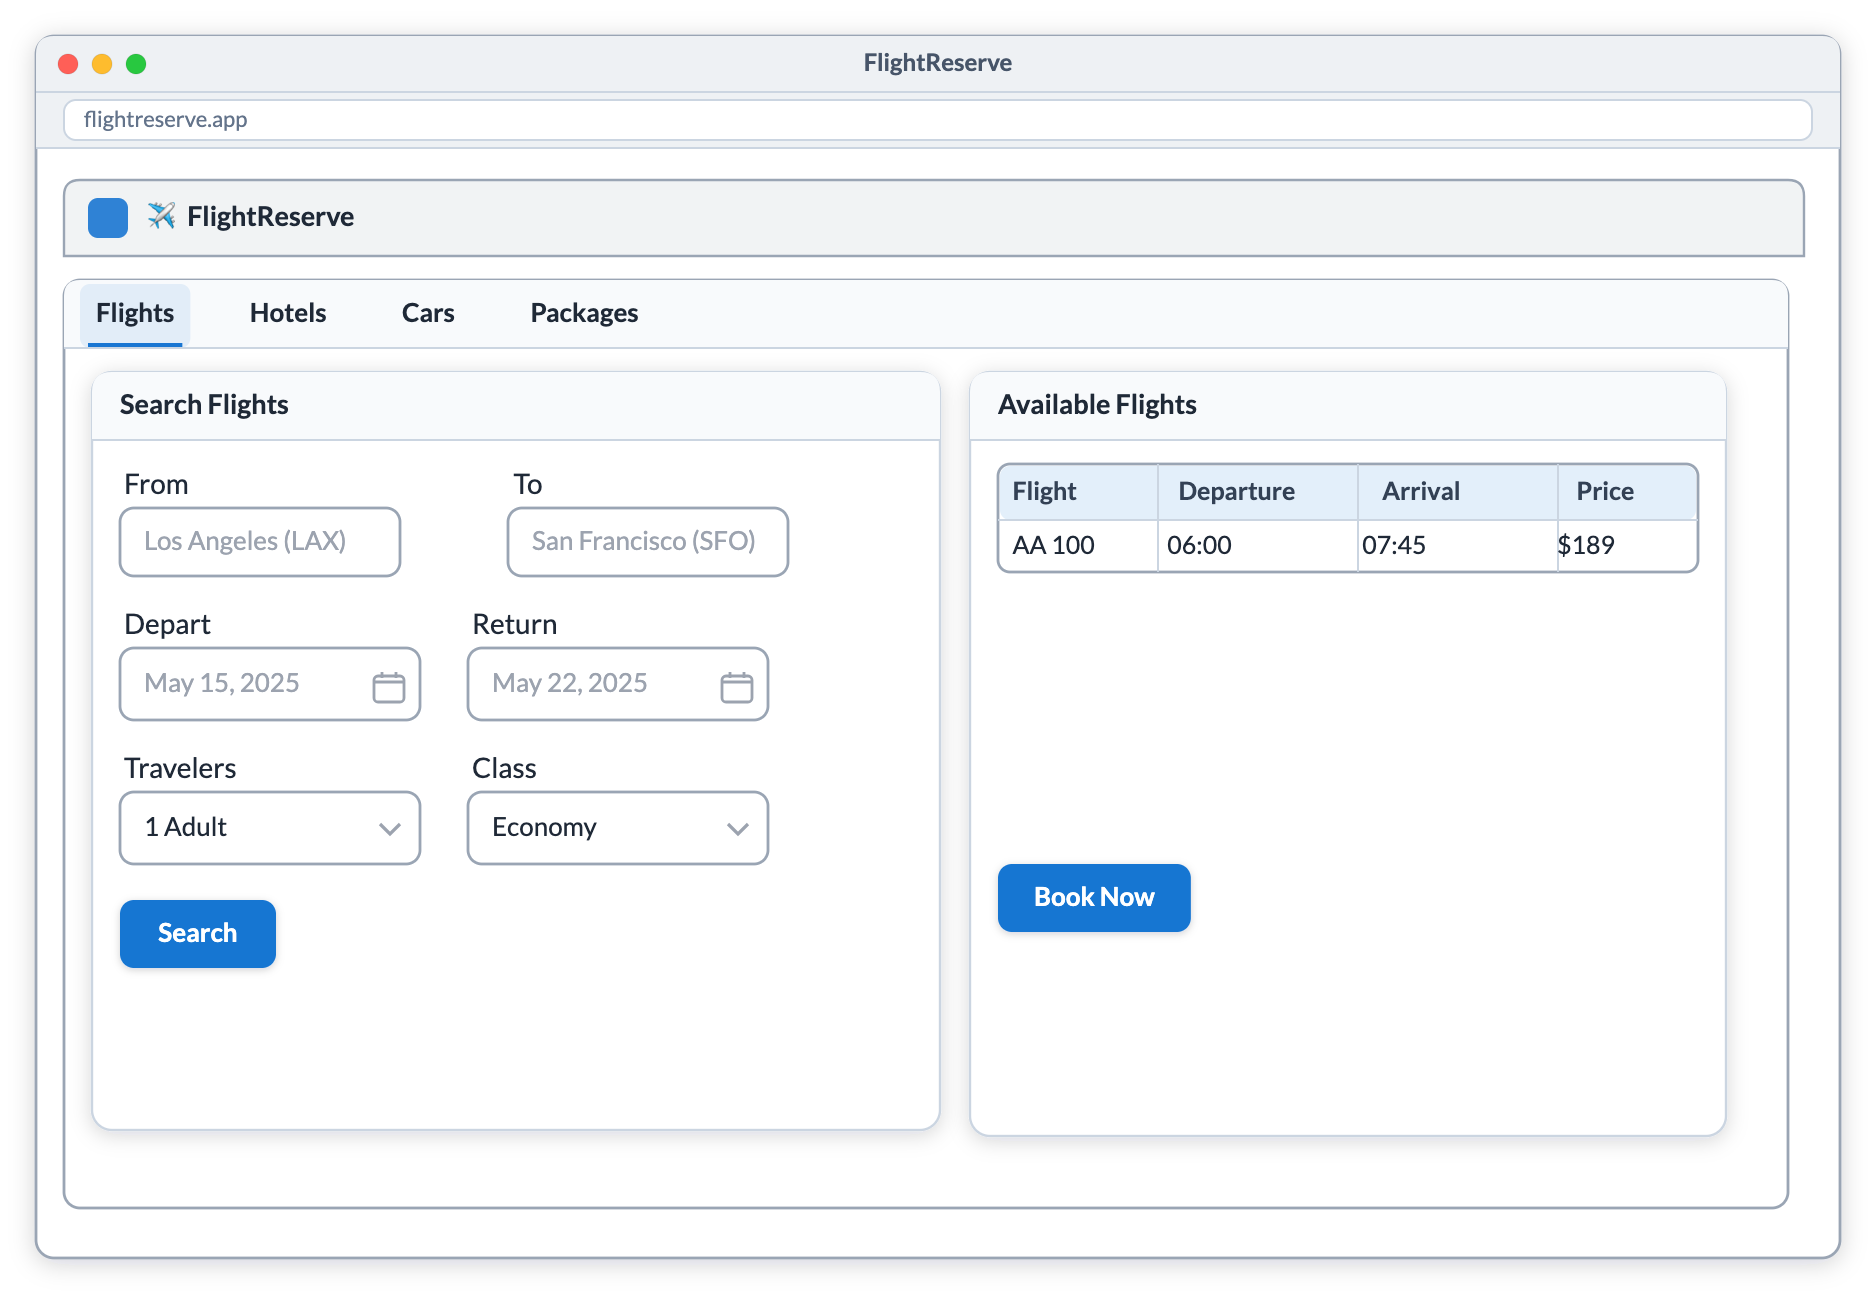
UI mockupInterfaces sketched with real widget semantics — windows, tab bars, cards, inputs and
tables that nest properly — so the mockup stays coherent while you rearrange.
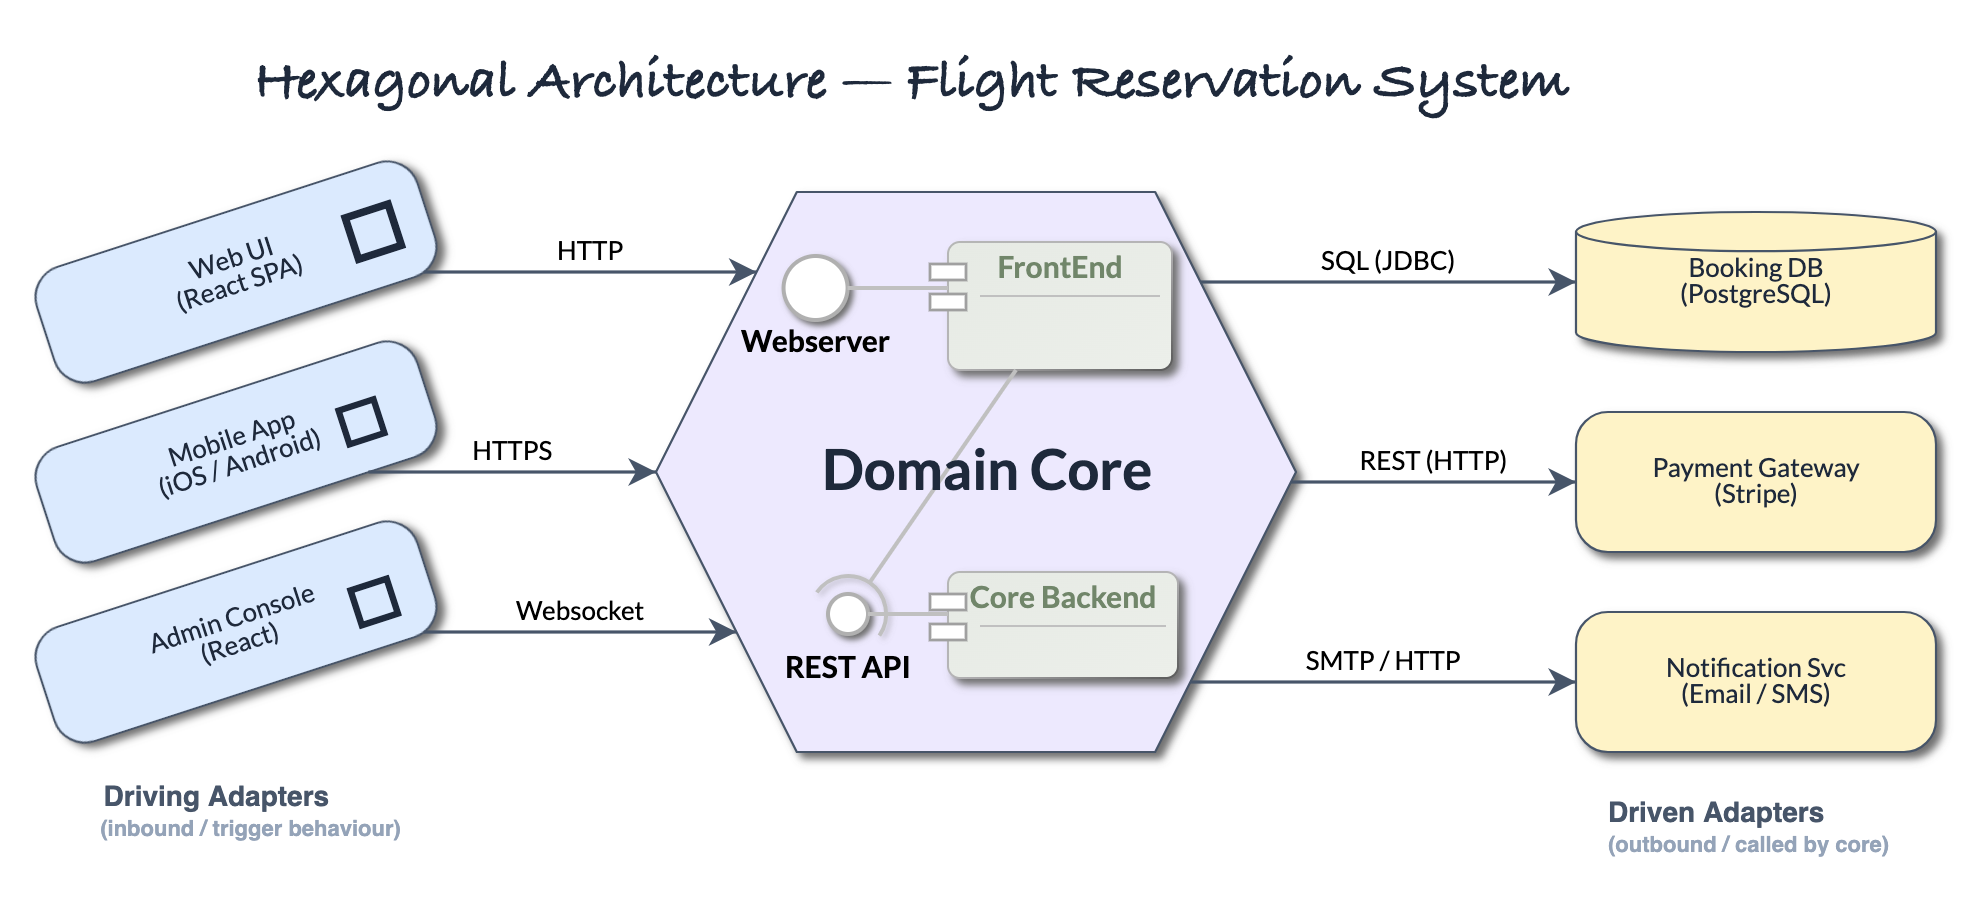
Shapes & free drawingGeneral shapes, icons and connectors for everything else — here a hexagonal
architecture, mixing freely with UML classifiers on the same canvas.